12.2 Linear Relationships
One of the most common types of relationships detected between the X and Y variables is a linear relationship (e.g., the type of relationship exhibited in Figs. 12.2a and 12.2b).
12.2.1 Exact Linear Relationships
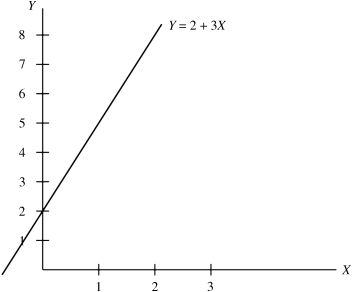
Suppose we have the equation Y = 2 + 3 X, where Y is the dependent variable and X is the independent variable (Fig. 12.3). Here “2” is the vertical intercept—the value of Y obtained when X = 0. The coefficient “3” attached to X is the slope (= rise/run) of the line—when X increases by one unit, Y increases by three units. More generally, the slope of this linear equation is the rate of change in Y per unit change in X. The expression Y = 2 + 3 X is “not a statistical equation”—it is an exact mathematical equation. There is very little (if anything) that a course in statistics can contribute to the understanding of this equation.
Figure 12.3 A linear equation.

Let us examine Fig. 12.2a again. We noted previously that this scatter diagram involving, say, n sample points exhibits a direct linear relationship between X and Y. In fact, because not all of the points (Xi, Yi), i = 1, . . ., n, lie on a linear equation passing through them, these points could “not” have been generated by an “exact” linear equation. This observation opens the door for the specification of a statistical model (called a regression model) that can describe the “goings-on” ...
Get Statistical Inference: A Short Course now with the O’Reilly learning platform.
O’Reilly members experience books, live events, courses curated by job role, and more from O’Reilly and nearly 200 top publishers.

