February 2002
Intermediate to advanced
356 pages
7h 56m
English
Up to this point, all graphics have been displayed “as is.”
There will be times when you have a graphic that you would like to move to
a new location, rotate, or scale. To accomplish these tasks, you add the transform attribute to the appropriate SVG
elements. This chapter examines the details of these
transformations.
In Chapter 4, you saw
that you can use x and y attributes with the <use> element to place a group of
graphic objects at a specific place. Look at the SVG in Example 5-1, which defines a square
and draws it at the upper left corner of the grid, then re-draws it with
the upper left corner at coordinates (50, 50). The dotted lines in Figure 5-1 aren’t part of the SVG,
but serve to show the part of the canvas that we’re interested
in.
<svg width="200px" height="200px" viewBox="0 0 200 200">
    <g id="square">
        <rect x="0" y="0" width="20" height="20"
            style="fill: black; stroke-width: 2;"/>
    </g>
    <use xlink:href="#square" x="50" y="50"/>
</svg>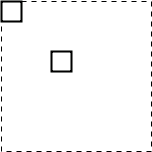 |
As it turns out, the x and
y values are really a shorthand for
one form of the more general and more powerful transform attribute. Specifically, the
x and y values are converted to an attribute like
transform="translate(
x-value, y-value
)", where translate is a fancy technical term for “move.” ...
Read now
Unlock full access


