UNDERSTANDING APP STORE DEMOGRAPHICS
To understand what customers seek out in an app, let's look at some of the statistics from Chapter 3 in more detail, and how understanding the end-user expectations behind them may help in your niche.
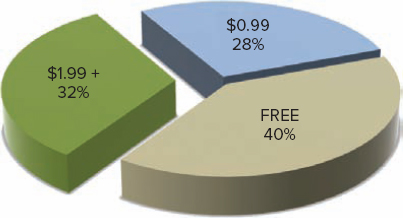
Firstly, more than one out of three apps are free, and free plus 99-cent apps equate to roughly two-thirds of all apps, as shown in Figure 4-1. So, out of roughly 500,000 active apps, about 185,000 of them are free (according to 148apps.biz), and about 315,000 are free or just 99 cents. That's huge. More than likely, customers can find what they want in some form for free, or for minimal expense, even if it is just a lite version.

FIGURE 4-1 Two of every three apps are either free or just 99 cents
The expectation in a market like this is that unless your app has some standout features and functionality — usually accompanied by glowing user/critical reviews — it likely won't be able to compete at a higher premium level. Customers in this market are just used to getting more for less.
Secondly, let's look at price. In Chapter 3, you learned that the average price of apps (not including games) is roughly $2.63, and the overall average price is roughly $2.39. Then you have games, with a rough average price of just $1.05. This tells you without a doubt that customers have plenty of choices, and they are not willing to spend more on games without good ...
Get The Art of the App Store: The Business of Apple Development now with the O’Reilly learning platform.
O’Reilly members experience books, live events, courses curated by job role, and more from O’Reilly and nearly 200 top publishers.

