CHAPTER 10
Huge Volume Reversals on Daily Charts
When a stock is in a steep bear trend on the daily chart and then has a day with volume that is five to 10 times its recent average, the bulls may have capitulated and a tradable bottom may be present. The huge volume day is very often a gap down day, and if it has a strong bull close, the odds of a profitable long increase. Traders are not necessarily looking for a bull reversal, but after a climactic sell-off, the odds are good that there will be at least a two-legged move to at least the moving average that will allow them to place a profitable trade that will last from days to weeks.
Incidentally, on a 1 minute Emini chart that is in a strong bear trend, if there is a huge volume bar (about 25,000 contracts), it is unlikely to be the end of the bear trend, but often is a sign that a pullback will come soon, usually after one or two lower lows on less volume (volume divergence). You should rarely if ever look at volume on intraday charts because of its unreliable predictive value on the 5 minute chart, which is the chart that you should mainly use for trading.
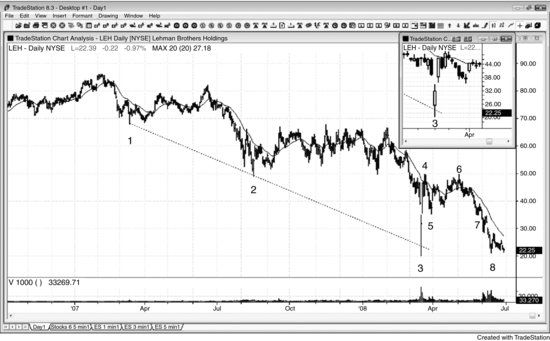
FIGURE 10.1 Huge Volume Reversal

Sometimes markets reverse up on huge volume days. As shown in Figure 10.1, Lehman Brothers (LEH) opened with a huge gap down on bar 3 and then ran below a bear trend channel line (from bars 1 and 2), but rallied strongly into the close. ...

