CHAPTER 21
Detailed Day Trading Examples
This chapter provides many detailed examples of reasonable day trades that incorporate the fundamental ideas from all three books.
FIGURE 21.1 T-Note 10,000-Share Chart
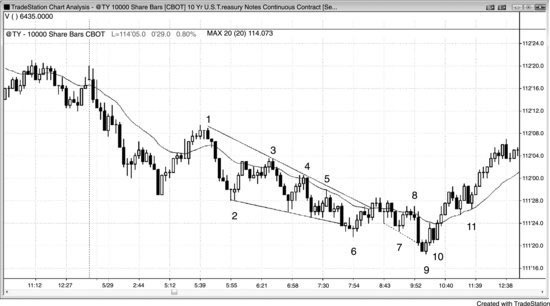
Figure 21.1 is a 10-Year U.S. Treasury Note Futures chart based on 10,000 shares per bar. Each bar closed as soon as the volume in the bar passed 10,000 contracts. Since the final trade in each bar can have any number of contracts, most of the bars have more than 10,000 contracts instead of exactly 10,000 contracts. The bars are not based on time, so some bars might take a few seconds to form, while others may take more than 10 minutes to surpass 10,000 contracts.
Bars 3, 4, and 5 were shorts on tests of the moving average in a bear trend.
Bar 6 was a second-entry bear trend channel line overshoot and reversal up, but the signal bar was weak (a small doji). However, the rally from the bar 6 wedge reversal broke the trend line, setting up a long on a test of the low.
Bar 7 was a two-legged higher low, but it was a doji, which is a sign of two-sided trading and not of strong buying, and it followed two strong bear trend bars. Although this was a minimally acceptable buy setup, it would have been better to wait for a stronger signal. If you took it, you would have exited below bar 8 because that was a low 2 short setup at the moving average and it had a bear body. That is ...

