Has a Windows PC ever seemed fast enough? One processor core, two processor cores, four processor cores, and more and more memory…no matter how powerful the hardware, you always want it to go faster.
In this chapter, you’ll find plenty of ways to improve system performance and get more productive when using Windows 8. Whether using the Task Manager to rev up your PC, using the new File History tool for recovering old versions of files, or finding out about free alternatives to Microsoft Office and more, you’ll find plenty of useful hacks.
Want to get more out of Windows 8 fast? Use these three fast hacks.
Sometimes you want to delve deep into Windows 8, spending a good deal of time in order to wring out big performance gains.
Given that you’re reading this hack, this isn’t one of those times. Because I’m going to offer you three quick hacks that let you get more out of Windows by spending hardly any time at all. They’ll let you schedule maintenance, display hidden administrative tools, and check your RAM for problems.
Windows 8 does a very good of maintaining your Windows 8 device in top shape behind the scenes—checking for software updates, performing system diagnostics, and performing security scans. It does this on a schedule of its own devising.
That schedule, though, might not be best for you. Maybe you’ll be working while maintenance is going on, and Windows disrupts your work. Or maybe you’d like it to perform certain tasks more frequently or less frequently. But no matter what the reason, it’s easy to change Windows 8’s default maintenance schedule. To get started, launch Control Panel and then choose System and Security→Action Center→Maintenance.
To run any maintenance task manually, click “Start maintenance,” and Windows 8 goes off and performs all of its normal maintenance tasks. It displays a small notification that “Maintenance is in progress.”
To instead change the maintenance schedule, launch Control Panel and then choose System and Security→Action Center→Maintenance→“Change maintenance settings.” From the screen that appears (Figure 4-1), choose the time of day you want the maintenance to be performed.
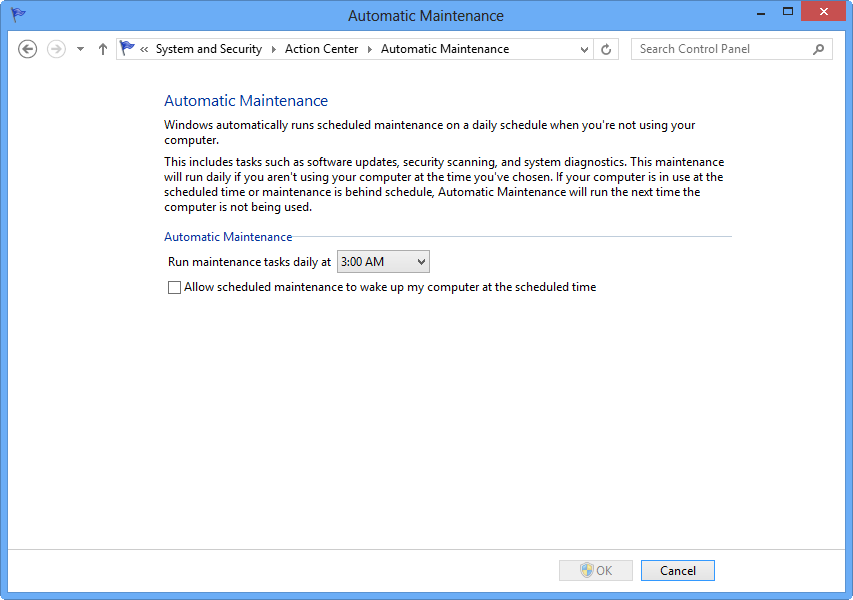
If you don’t see the “Start maintenance” or “Change maintenance settings” options when you get to this screen, click the down arrow next to Maintenance.
Windows 8 has a whole host of very useful administrative tools, such as the Performance Monitor, Resource Monitor, memory diagnostics, and many more. But looking at the tiles on the Start screen, you wouldn’t know that. That’s a problem, because you can’t even see what useful administrative tools Windows 8 has.
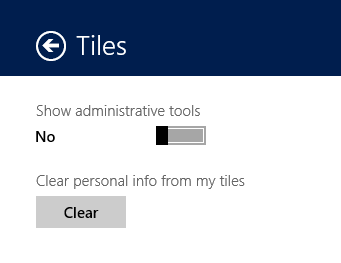
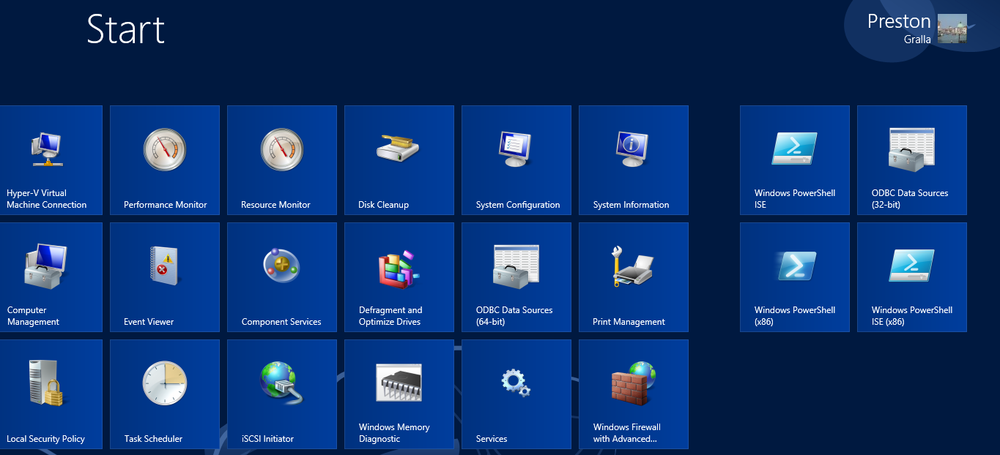
There’s an easy fix. When you’re on the Start screen, press Windows key+C, select Settings→Tiles, and turn on the “Show administrative tools” setting (Figure 4-2). When you do that, they’ll all be within easy reach on the Start screen. You’ll likely have to scroll all the way over to the right to see them, grouped together (Figure 4-3).
There’s another way to get access to these tools. Right-click the lower-left corner of the screen, and a menu pops up with to several of them, as well as some tools not available as tiles, such as the elevated command prompt.
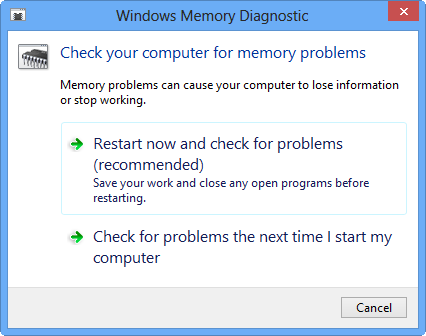
Now that you’ve turned on administrative tools, it’s time to start using them. If you’ve found your system experiencing odd problems, you may have problems with your memory. Click the Windows Memory Diagnostics tile (you’ll be reminded to save your work and close running programs if you haven’t already), and then click “Restart now and check for problems” (Figure 4-4). Your computer will shut down, and Windows will check for memory problems. Be patient, because the test can take some time. You can watch a progress bar as the test digs into your computer’s memory.
See Also
Got a sluggish PC? The System Monitor is one of the best ways you’ll find in Windows 8 for tracking down the source of the problem.
At some point in the life of your Windows 8 device it may become sluggish, slow down, or otherwise have problems. Tracking down these problems can be exceedingly difficult. As you’ll see in [Hack #37], the Task Manager is one very good tool for finding them.
But there’s also a very useful, lesser-known tool called the Resource Monitor (Figure 4-5) that helps as well. It’s extremely useful for tracking down the cause of sluggish performance. It shows you what kind of resources your system uses, and which applications and services are making the most use of your system.
To run it, type Resource Monitor at the Start screen, click Files, and then click the Resource Monitor icon that appears. (If you’re turned on the display of Administrative tools, as outlined in [Hack #33], you can also click the Resource Monitor tile on the Start screen.)
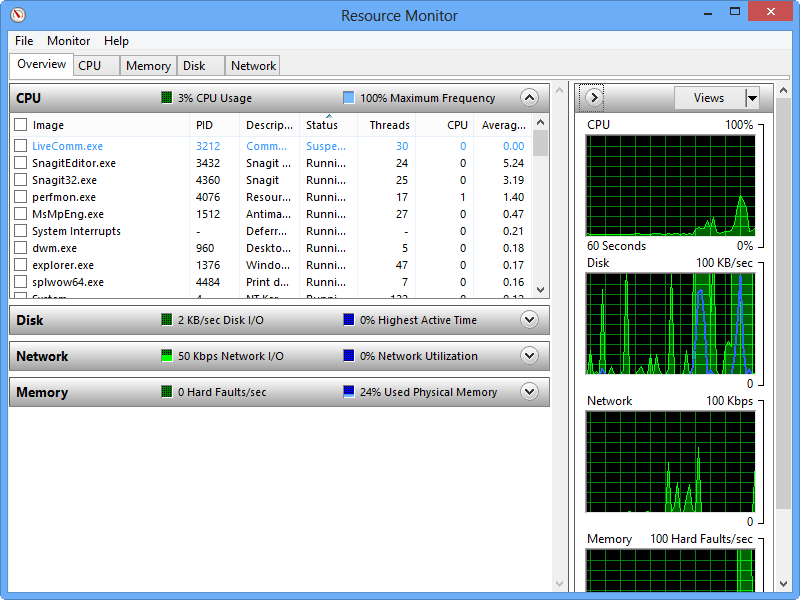
Figure 4-5. The Windows 8 Resource Monitor is an excellent tool for tracking down the cause of sluggish performance
The Overview tab display a snapshot of your system—CPU use, disk use, network use, and memory use. On the righthand side, you see their use over time. On the lefthand side, you see details about their use. Click the down arrow next to CPU, Disk, Network, or Memory to display details. Or you can instead just look at the overview. The other tabs—CPU, Memory, Disk, and Network—show in-depth details.
The Resource Monitor is easy to interpret. If you see high usage on any of the tabs, you’ll know you’ve got a problem there. Then, it’s time to track down the cause. Each tab shows you which applications or services are making use of that particular resource. For example, the CPU tab shows all the apps and services using the CPU. It shows a running average of CPU use for each app and service. Those that use the most CPU are listed at the top; those that use it the least are listed at the bottom. So, for example, if you’ve got an over-taxed CPU, look at which apps or service overuse it. Close them to solve the immediate problem, and consider finding alternatives for the future.
The other tabs work the same way. The display in each tab varies according to what information is the most useful. For example, the Memory tab (Figure 4-6) shows, in addition to which programs and services are using memory, how much is currently used, cached, reserved for hardware, and so on.
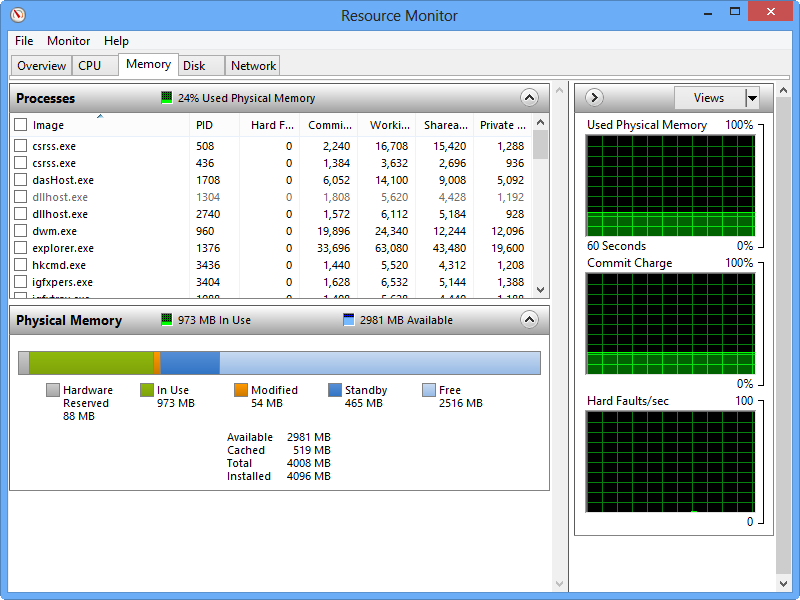
Figure 4-6. The Windows 8 Resource Monitor is an excellent tool for tracking down the cause of sluggish performance
See Also
Here’s the single best place to go in Windows 8 for getting the inside info on system performance and reliability.
Windows 8 offers a great tool for checking your system’s reliability and tracking down potential causes of problems. It’s the Reliability Monitor, and it offers a real-time, live snapshot of system performance, as well as a historical view of overall reliability, complete with detailed information about system crashes.
To run it, type Reliability at the Start screen, click Files, and click the “view reliability history” icon that appears. It shows how reliable your PC has been over time, gives it a reliability rating, and offers details about system crashes (Figure 4-7).
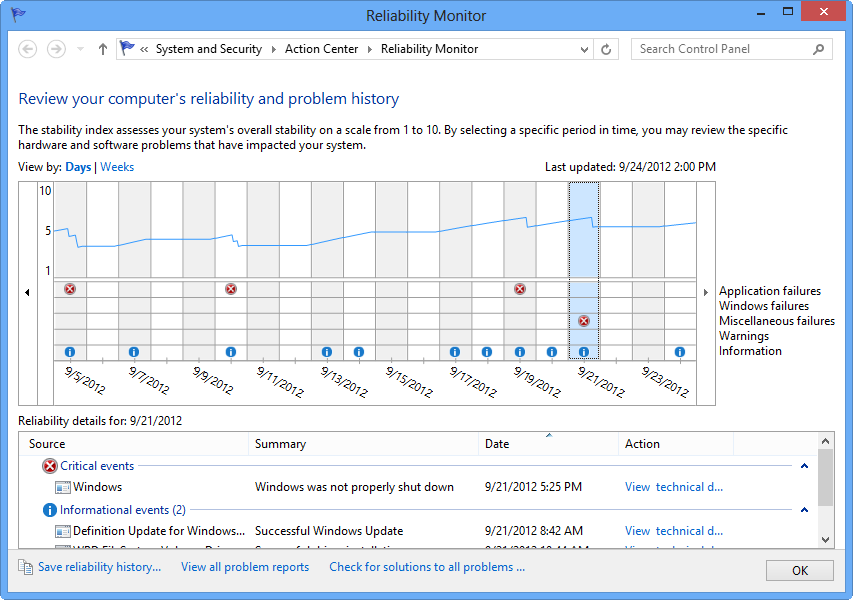
The blue line moving across the graph represents a number that Windows 8 calculates gauging your system’s overall reliability on a scale from 1 to 10. Every time there’s a system failure, application failure, and so on, the index drops—sometimes precipitously, especially if there has been more than one failure in a day. For example, on my Windows 8 PC, I had three failures in one day, and the reliability index dropped from over 5 to under 3.
For every day that your system doesn’t have a failure, the index rises a little bit. But exactly how Windows 8 calculates the amount of drops and rises is rather mysterious.
Even more important than the overall reliability index are the details of each system crash. Go to each day that has a crash, and see the cause: an application, an overall system failure, and so on. Look for patterns, such as if a certain application frequently crashes. If so, uninstall it, or look for an update that fixes the problem.
Beneath the moving chart, issues are grouped into categories, including Application failures, Windows failures, Miscellaneous failures, Warnings, and Information, so you can see at a glance what kind of issues you have.
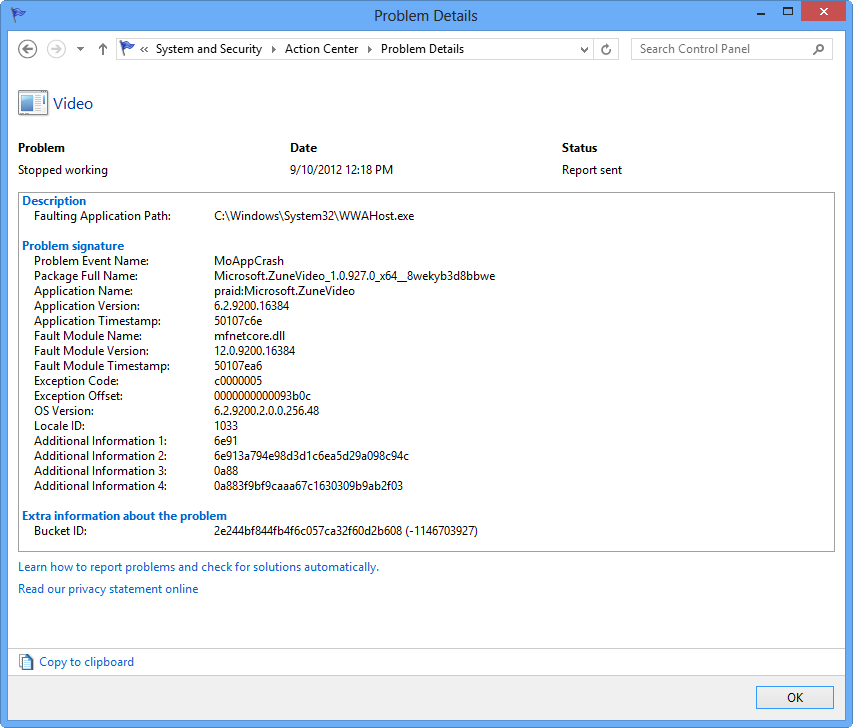
Down at the bottom of the screen, click “View all problem reports,” and rather than seeing a moving chart over time, you instead see a list of all of your problems, including summaries, as in Figure 4-8.
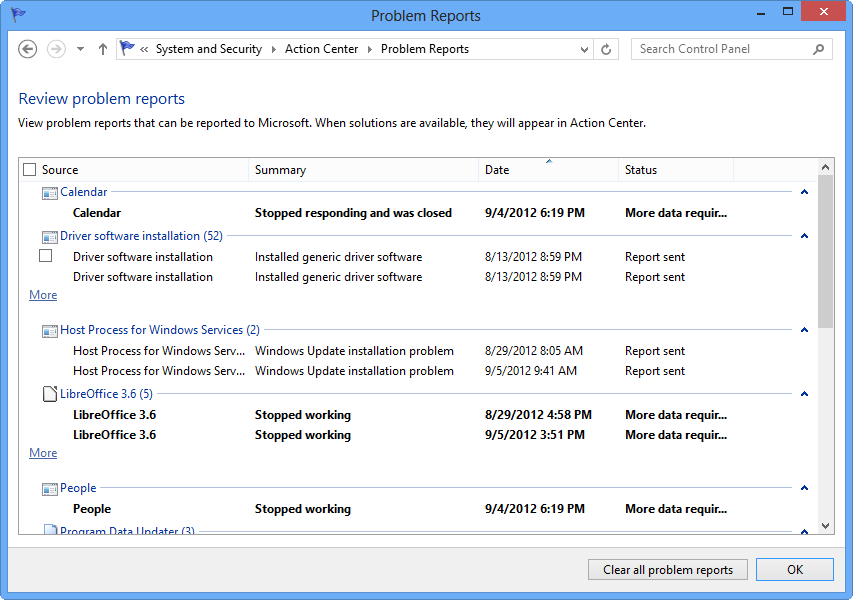
If you want details about each crash and system problem—excruciating detail, in fact—double-click any of them. You’ll see a screen like that shown in Figure 4-9. Details include the file name and path, and the kind of information that might be useful to programmers to track down the cause of the problem. Click the “Copy to clipboard” link at the bottom of the page, and all the details will be copied to the clipboard. From there, you can paste it into a file and send it to tech support, who might be able to use it to help with troubleshooting.
See Also
If you’re looking for x-ray vision into your PC’s performance, here’s where to go. Just don’t expect to understand what you see.
Sometimes you want to see something just because you want to see it. Not necessarily because it might help you accomplish something, but because... well, sometimes it’s not that clear why, but you just do.
That’s how I feel about the Performance Monitor. This tool shows you more details about the inner workings of your Windows 8 system, hardware, and software than you could possibly imagine. Whether you understand what you see is another thing entirely. But sometimes, it’s fun just to see.
To launch the Performance Monitor, type Performance Monitor at the Start screen, click Files, and click the Performance Monitor icon that appears. (If you’ve turned on the display of Administrative tools, as outlined in [Hack #33] you can also click the Performance Monitor tile on the Start screen.) You can see the Performance Monitor in action in Figure 4-10.
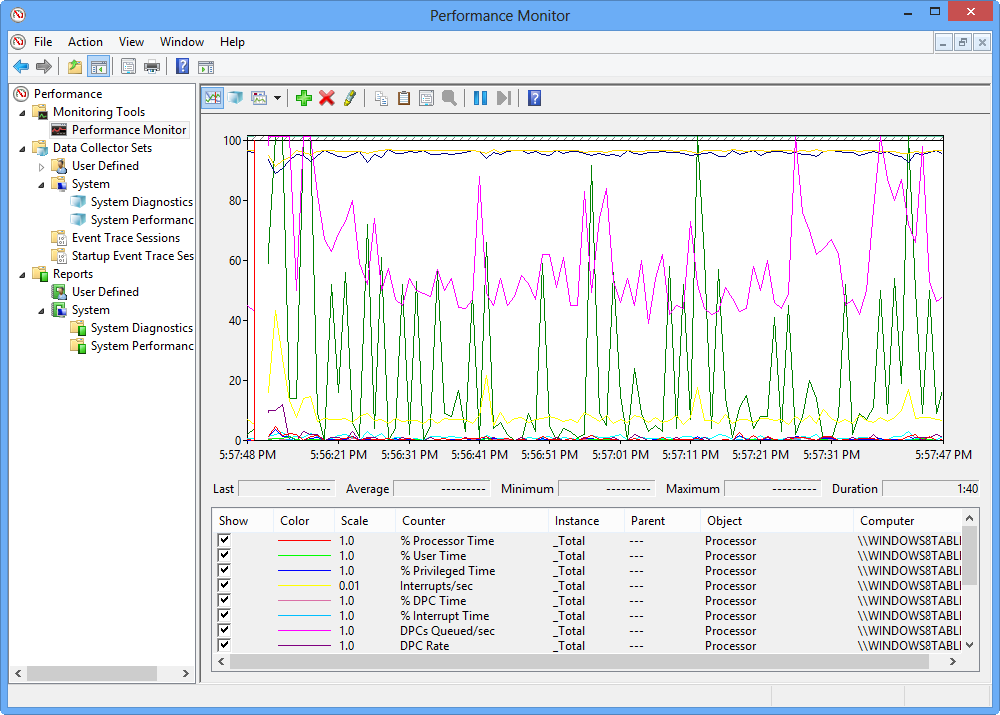
What you see may or may not look exactly like what you see in the figure, because the Performance Monitor is extremely configurable. It shows a moving snapshot of system performance in exquisite detail over time. You can easily add those details, so you can monitor hard disk performance, processor performance, browser performance, and so on.
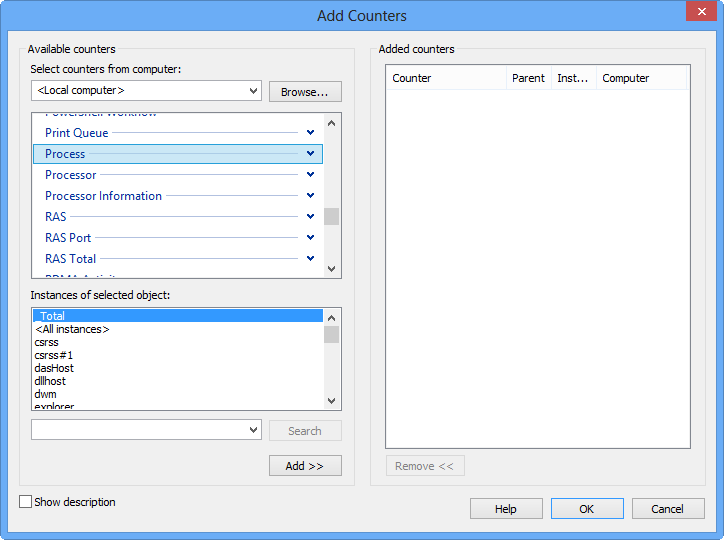
Performance Monitor works by using what it calls counters, which are modules that track your system’s use. To add a counter, right-click in the graph area, select “Add counters” and then scroll through the available counters (Figure 4-11). Some are easy to figure out, such as Processor or Print Queue. Others, such as Pacer Pipe or NUMA Node Memory, will be baffling.
Each counter is made up of one or more subcounters, often many more. And here’s where things can get confusing, even when you think you have a sense of what a counter does. In the Processors subcounters, for example, it’s clear what %Processor Time does, but not DPC Rate.
Add whichever you want, and then head to the graph to watch your system’s performance.
See Also
This humble tool does more than show you which applications are running; it can help juice up your PC’s performance as well.
As you may know, the Task Manager shows you all programs and processes running on your system and lets you shut down any you don’t want to run any longer. But it can do much more than that; it can also help fine-tune system performance.
There are five common ways to run the Task Manager:
Press Ctrl+Shift+Esc.
Right-click the taskbar on the Desktop, and choose Task Manager.
Type Task Manager at the Start screen, and then click the Task Manager icon that appears.
Press Ctrl+Alt+Del, and then choose Task Manager from the screen that appears.
Right-click the lower left portion of your screen and select Task Manager.
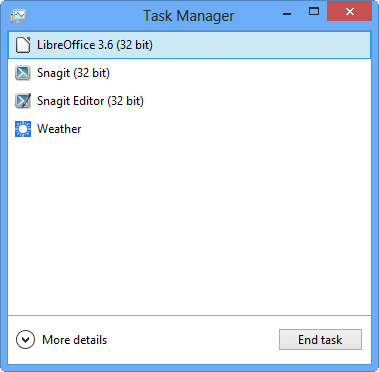
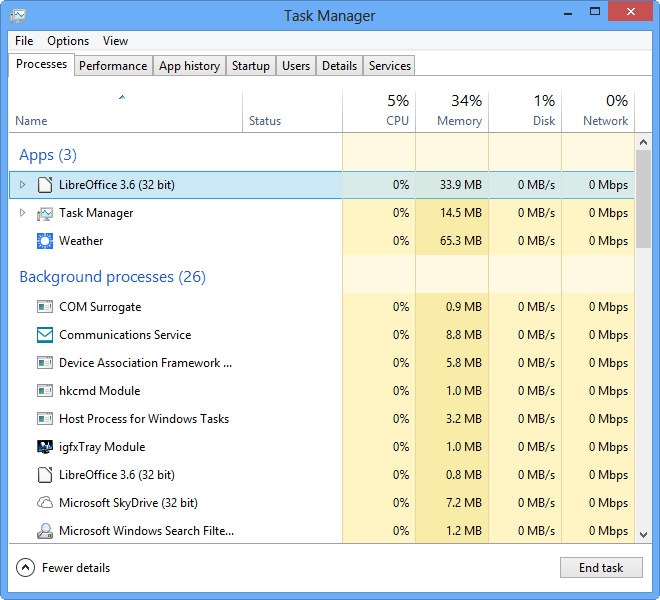
In Windows 8, unlike in previous versions of Windows, the Task Manager has two interfaces: A stripped-down simplified one, shown in Figure 4-12, and a much more detailed robust one, shown in Figure 4-13, which you use for troubleshooting and improving system performance. To switch between them, click the “More details” down arrow when you’re in the simplified version, or click the “Fewer details” up arrow when you’re in the more detailed version.
The robust, detailed version of Task Manager has seven tabs, but you’ll generally use the App History, Processes, and Performance tabs to help improve system performance. In this hack, I’ll cover how to use the detailed version of the Task Manager.
Note
Note: The Task Manager is also a great tool for speeding up system startup and stopping unnecessary programs from launching at startup. For details on how to use it, see [Hack #4].
Before you can learn how to use the Task Manager to improve performance, you’ll need some background about the tabs you’ll use most: Processes, Performance, Users, and App history.
The Processes tab (shown in Figure 4-14) reports on every process running on your computer, as well as a variety of services run by the operating system and currently running apps. It reports on the percentage of the CPU that each process uses, as well as how much memory, disk capacity, and network resources each process uses.
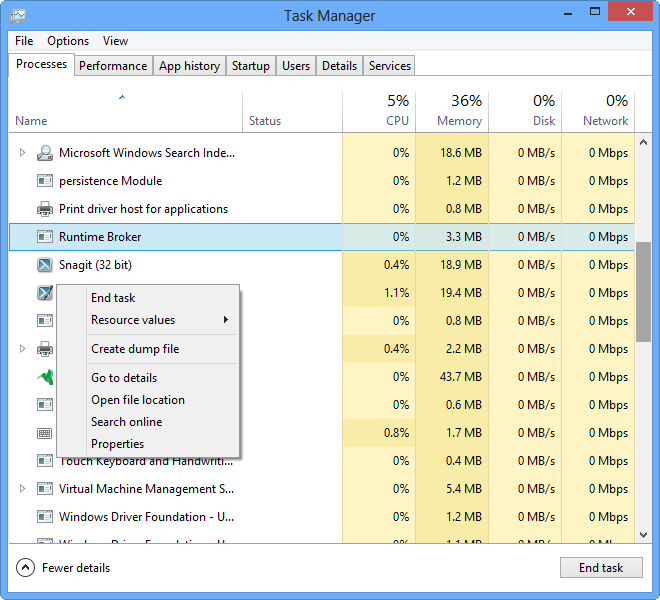
When you right-click any app, service, or process, you get a menu of choices that allow you to manage it in a variety of ways, including ending it along with any related processes (if there are any), as shown in Figure 4-14.
When you right-click an application, a menu of choices lets you manage the application in several ways; you can switch to it, move it to the front, minimize it, maximize it, or end it. The Go To Process option takes you to the application’s process on the Processes tab. You can get more information about the application this way.
The Performance tab shows a variety of performance measurements, including CPU, Memory, Disk, Ethernet, Bluetooth, and Wi-Fi use, as shown in Figure 4-15.
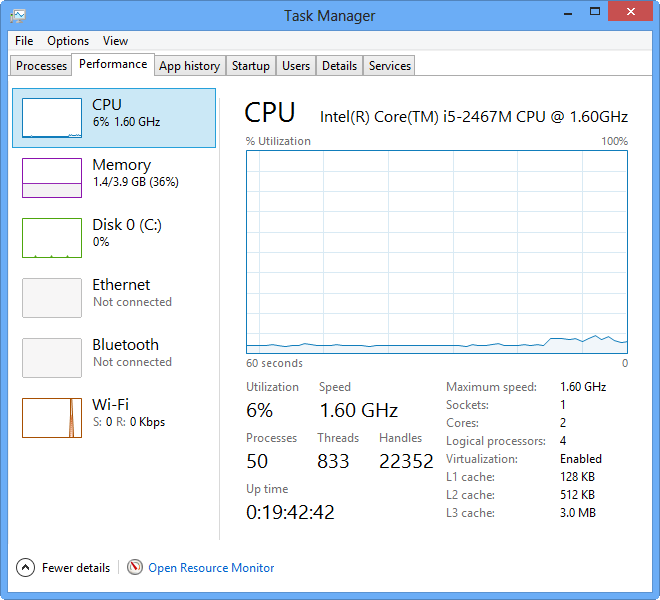
You’ll use this tab more than any other when tracking system performance and unstopping bottlenecks. The Performance tab has thumbnail graphs on the left showing high-level details about the performance of each measurement it tracks. Click any thumbnail, and the right-side portion of the screen shows a larger, more detailed graph and additional information. For example, click Memory, and you’ll get information about your total memory, how much is in use, how much is available, how much is cached, and so on.
There are multiple ways to use this tab to help improve system performance. Look at the thumbnail graphs and see if utilization is too high on any of them. If you’ve got high CPU use of more than 80 percent or more, you might be experiencing system slowdowns. As I’ll explain later in this hack, you can then track down which apps are using too much CPU and close them down. Similarly, if you see high memory use, you’ll want to track down which apps are using too much memory, and close them down as well—and I’ll show you how to do that later in this hack, too. And you can do the same thing with the other thumbnails. Wi-Fi shows you your bandwidth speed, among other details, for example, so that you can tell whether you’ve got connection problems.
Task Manager updates its data every two seconds, and each vertical line on the graphs represents a two-second interval. To change the update time, choose View→Update Speed, and select High or Low. When you select High, updates take place twice a second. When you select Low, updates take place once every four seconds. To stop updating altogether, select Pause. To do an immediate update, select “Refresh now” or press F5.
If you’re familiar with the pre-Windows 8 Task Manager, you’ll see a big difference between this tab and the old Applications tab in previous versions of the Task Manager. The old Applications tab displayed a list of every application currently running on your PC, like Word, Excel, Windows 8 native apps, or any other application. It also reported on the status of each application.
In the Windows 8 Task Manager, you check the Processes tab to get that kind of information. The Windows 8 App history tab serves a very different purpose—to provide information about Windows 8 native apps, and see the ways in which they’ve been used over time. It doesn’t give information about Desktop apps.
For each app, the tab shows the total CPU time it’s taken up, the total amount of network bandwidth it’s used, the total metered bandwidth it’s used (see [Hack #72]), and the total amount of data used by the apps’ tile updates.
How can this tab help you? Perhaps its greatest use is in tracking down network bandwidth hogs. Check the Network, “Metered network, ”and “Tile updates” columns to see each app’s bandwidth use. You’d expect a network-centric app like Internet Explorer to use a lot of bandwidth, so don’t be surprised if it’s your biggest bandwidth consumer. But if you see an app whose operation is not Internet-centric or network-centric taking up gobs of bandwidth, you might have a problem.
Similarly, if you notice that an app that you rarely run takes up what seems to be an inordinate amount of CPU time, you’ve probably found a CPU hog.
What to do in those cases? Consider uninstalling the app or finding an alternative to it.
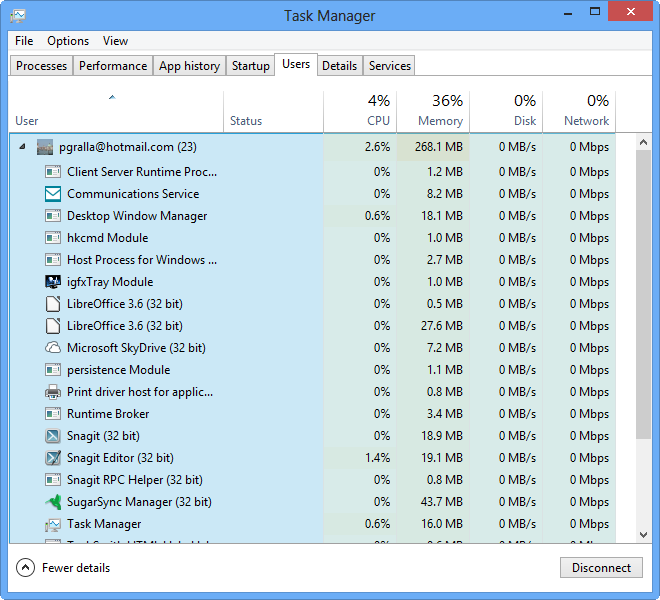
This tab displays the currently logged-on users of your machine and shows how much CPU, memory, disk, and network resources the currently logged-on user is consuming (Figure 4-16). If you see any currently logged-on user taking up too many resources, consider switching to that account and logging the user off.
You can also see details about the apps, resources, and services for each user by clicking the triangle next to that user. From there, you can identify any apps, resources and services that take up too much CPU, memory, disk, or network resources. You may be able to close down those apps, resources, and services as a way to ease the stress on your system.
Today’s microprocessors can handle most tasks easily, but CPU-intensive software or tasks such as computer-aided design (CAD) programs, CD burning, and games can slow down a system significantly. So can multitasking many apps simultaneously. A common cause of CPU slowdown is that one or more programs or processes take up too much of the CPU’s attention. You can use the Task Manager to monitor your CPU use and, based on what you find, take steps to help your system run faster.
Monitor your CPU usage using the Performance tab of the Task Manager. If you find a problem, head over to the Processes tab. On that tab, check the percentage of the CPU that any individual program uses. To make it easier, click the CPU column; it will show the apps, services, and processes that take up the most CPU time at the top. The topmost listed takes up the most, the second listed takes up the second most, and so on. Once you determine which one you want to close, right-click it, and select End Task. (For an app, though, you’ll be better off if you instead switch to it and close it down from the app interface. That way, you won’t lose any files or data associated with it.) Your system will get a quick performance boost. If you need to run that application, close any other applications that take up too much CPU attention.
Tip
Tip: It’s probably not a good idea to close down Windows 8 native apps from the Task Manager. Windows 8 does a very good job of monitoring them, and closes or pauses them when you no longer need them, except for background tasks like updating its tile or fetching new mail.
Tracking CPU usage in real time
If your CPU regularly uses a high percentage of its capacity, it means there’s a bottleneck. You should upgrade the CPU, buy a new computer, or run fewer programs. But how can you know whether your CPU has a bottleneck? Check your CPU use. Run Task Manager, and make sure Options→Hide When Minimized is selected. Now, whenever you minimize the Task Manager, it will sit in the Taskbar’s System Tray area. The first time you minimize Task Manager like this on Windows 8, you should drag it from that area and place it next to the icons for the Action Center, Power, Network, and Sound.
Now, minimize the Task Manager. It will appear as a small bar graph in the System Tray that lights up green as you use your CPU. To see your current CPU usage, hold your mouse cursor over the Task Manager’s icon in the System Tray. Try running different combinations of programs, and monitor your CPU use with each combination. If you find your CPU is overburdened on a regular basis, it’s time for an upgraded CPU or a new computer.
Windows gives a base priority to every program and process running on your PC; the base priority determines the relative amount of CPU power the program or process gets, compared to other programs. Here are the priorities Windows assigns:
Low
Below Normal
Normal
Above Normal
High
Real Time
Most programs and processes are assigned a Normal priority. But you might want to give a program like a CAD or graphics program more of your CPU’s attention. That way, the program will get the CPU power it needs and run more smoothly and quickly. If there are programs or processes that normally run in the background or rarely need your CPU, you can give them less of your CPU’s attention.
You can use the Task Manager to change the priorities assigned to any process or program. The Low, Below Normal, Normal, Above Normal, and High priorities are self-explanatory, but Real Time may be unfamiliar. Real Time devotes an exceedingly high number of CPU cycles to the given task—so much so that even the Task Manager might not be able to interrupt any program or process assigned that priority. So don’t assign a Real Time priority to any program or task unless it will be the sole program or task running on the PC. Of course, if it’s the only program or task running, you really don’t need to give it a high priority, because it already has your CPU’s complete attention.
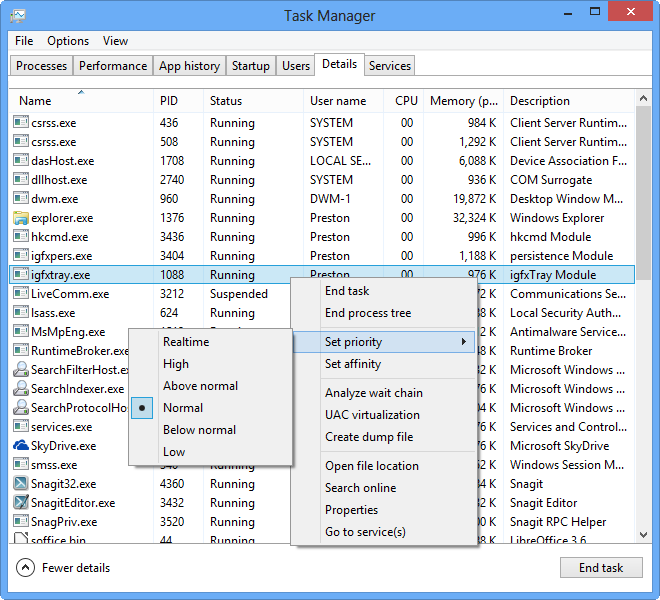
To change the priority of a running program or process, use the Details tab. On that tab, right-click the program or process whose priority you want to change, highlight Set Priority, and choose a priority, as shown in Figure 4-17.
Be careful when using this feature, because it can have unintended consequences and lead to system instability. If you find it causes problems, stop using it.
Note
Note: Keep in mind that when you assign a new priority to a process or program, that new priority sticks only as long as the program or process is running. Once the program or process ends and you restart it, it defaults to the priority assigned to it by Windows.
See Also
Want to be more productive when using Windows 8? Use these keyboard shortcuts instead of mousing around.
Think of all the time you spend in Windows 8 using your mouse to accomplish simple actions—opening the Charms bar, opening a new window in Internet Explorer, showing the Desktop. It’s plenty of time and plenty of movement.
It doesn’t have to be that way. You can get a lot done just using your keyboard. Use out the following tables for keyboard shortcuts, and you’ll save miles of mouse movements, and plenty of time as well.
Keyboard Combination | What It Does |
|---|---|
Windows key | Goes to Start screen or toggles between the Start screen and your current action |
Windows key+C | Open Charms bar |
Windows key+D | Show the Desktop |
Windows key+E | Open Windows Explorer |
Windows key+F | Go to Files in the Search charm |
Windows key+H | Go to the Share charm |
Windows key+I | Go to the Settings charm |
Windows key+K | Go to the Devices charm |
Windows key+L | Locks your PC |
Windows key+M | Minimize all windows (only on the Desktop) |
Windows key+O | Lock the screen orientation |
Windows key+P | Open Projection Mode pane |
Windows key+Q | Go to the Search charm |
Windows key+R | Launch the Run box |
Windows key+T | Put the focus on the Taskbar and cycle through your running Desktop apps |
Windows key+U | Open the Ease of Access Center |
Windows key+V | Cycle through your notifications |
Windows key+W | Go to Settings in the Search charm |
Windows key+X | Open the power user menu |
Windows key+Z | Go to the app bar |
Windows key+1 through 9 | Go to the app on the corresponding position on the Taskbar (Desktop only) |
Windows key++ | Zoom in (when using Magnifier) |
Windows key+− | Zoom out (when using Magnifier) |
Windows key+, | Peek at the Desktop (on Desktop only) |
Windows key+. | Snap a Windows 8 native app to the right (Windows key+Shift+. snaps it to the left) |
Windows key+Enter | Opens the Narrator |
Windows key+Spacebar | Switches the input language and keyboard layout |
Windows key+Tab | Cycle through the Windows 8 native app history |
Windows key+Esc | Exit the magnifier |
Windows key+Home | Minimize non-active desktop windows |
Windows key+Page Up | Move Start screen or any Windows 8 native app to left monitor |
Windows key+Page Down | Move Start screen or any Windows 8 native app to right monitor |
Windows key+Break | Open System Properties |
Windows key+Left arrow | Snap desktop window to the left |
Windows key+Right arrow | Snap desktop window to the right |
Windows key+Up arrow | Maximize desktop window |
Windows key+Down arrow | Restore/minimize desktop window |
Windows key+F1 | Run Windows Help and Support |
Keyboard Combination | What It Does |
|---|---|
Ctrl+A | Select all |
Ctrl+C | Copy |
Ctrl+E or F4 | Select the Search box in Internet Explorer (Select Address Bar in Desktop version) |
Ctrl+N | Open new window in Internet Explorer (Desktop version only) |
Ctrl+R or F5 | Refresh |
Ctrl+V | Paste |
Ctrl +X | Cut |
Ctrl+Y | Redo |
Ctrl+Z | Undo |
Ctrl+Tab | Cycle through the Windows 8 native app history |
Ctrl+Esc | Go to the Start screen |
Ctrl+Ins | Copy |
Ctrl+F4 | Close the active document (closes the current tab in Internet Explorer) |
Ctrl+click | Select multiple items in File Explorer |
Ctrl+Shift | Select a group of contiguous items in File Explorer |
Ctrl+W or Ctrl+F4 | Close the current window in Internet Explorer (Desktop version) |
Ctrl+Shift +Esc | Run the Task Manager |
Ctrl+Shift+N | Create a new folder in Windows Explorer |
Ctrl+Alt+D | Dock the Magnifier at the top of the screen |
Ctrl+Alt+L | Put Magnifier into lens mode |
Ctrl+Alt+I | Invert the Magnifier’s colors |
PrtScn | Take a screenshot and place it on the Clipboard |
See Also
Got a tablet or touchscreen device? Here’s the lowdown on gestures you can use.
Windows 8 is the first Microsoft operating system designed from the ground up to run using a touchscreen with a feature called multitouch, Obviously, this feature is mostly intended for tablets, but you’ll find plenty of desktops and laptops with touchscreens as well.
But touchscreen gestures aren’t always intuitive, and there are some you may not know about. So use the following table of touchscreen gestures to get up close and personal with your Windows 8 device.
Note
Note: Not all of these gestures work in all places and apps on Windows 8, so you may need to test some. Typically, they don’t work on Desktop apps.
See Also
Windows 8 has its own Wayback Machine called File History. Here’s how to turn it on and use it so you’ll never lose a version of a file again.
It happens to everybody: you’ve accidentally deleted a file and now can’t find it. Or you’ve made changes to a file, only to realize that it was better before you made the changes. Or maybe you simply want to see a file’s entire version history. Or, worst of all, your hard disk crashed, and you want to recover files.
Windows 8’s File History brings that capability, much like that of Mac OS X’s Time Machine, for the first time to Windows. Windows 7 had a feature similar to it, called Previous Versions. But Previous Versions was hard to find and even harder to use. It was, to be honest, something of a failure.
Not so File History. It’s a great, though not perfect, feature of Windows 8. There’s a good chance that you don’t know about it, because it’s not enabled by default and there’s no app tile for it, so it’s not that easy to find. But as you’ll see in this hack, once you use it, you’ll be glad you found it.
Before we get hacking, a few words about what File History does and how it works. It backs up whatever it finds in your Libraries, on your Desktop, in Contacts, and in Favorites, and then lets you restore what it’s backed up, including interim versions of your files.
This all means backing up a lot of files, because your Libraries contain, at minimum, the following folders:
My Documents
Public Documents
My Music
Public Music
My Pictures
Public Pictures
My Videos
Public Videos
SkyDrive (only if you’ve installed the local SkyDrive client and have local SkyDrive folders on your PC)
Tip
Tip: As you’ll see later in this hack, there are ways to exclude folders from File History. So if you don’t want to back up, for example, videos because they take up too much space, you can exclude folders that contain your videos.
In addition to that, you can add individual folders to File History as well.
With that as background, let’s get started.
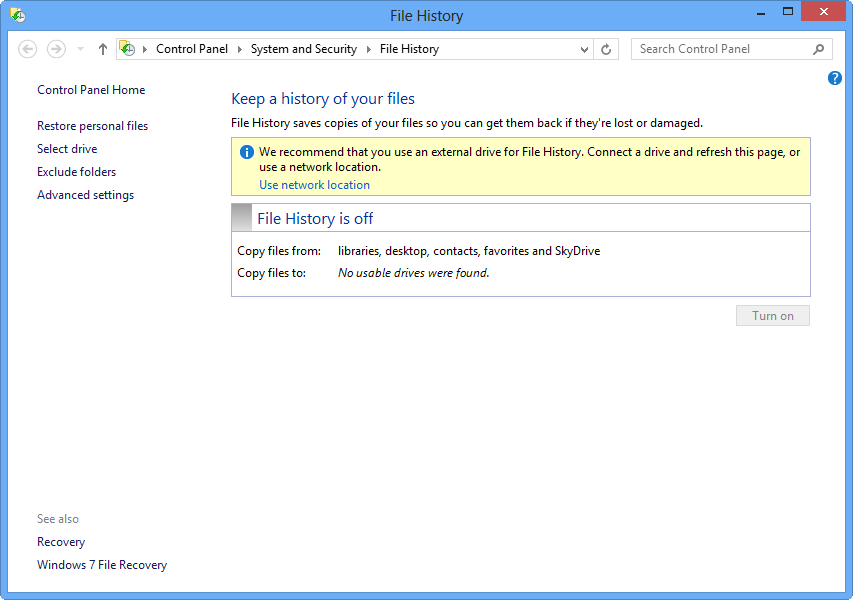
By default, File History is turned off, and Windows 8 doesn’t even
tell you it’s there. But it’s not too hard to find. On the Start screen,
type File History, click Settings, and then click
the File History icon that appears on the left side of the screen.
You’ll come to a screen like the one in Figure 4-18.
You’ll need to set where to save copies of your files. You can’t choose the hard drive on which you have the files you want backed up, because that would defeat one of the main purposes of the feature—the ability to restore files from a crashed hard disk.
If you have more than one hard disk, you can use one of those disks as the location for storing the backed-up files. But it’s a better idea to instead use a different disk or location; for example, a folder on another PC on your network, or USB-attached storage.
When you get to the screen, you’ll be told that File History is turned off. You’ll also see any additional hard drives beyond your primary one, as well as any removable storage connected to your device, such as a USB hard drive or USB flash drive. If you haven’t connected them, now’s the time to do it.
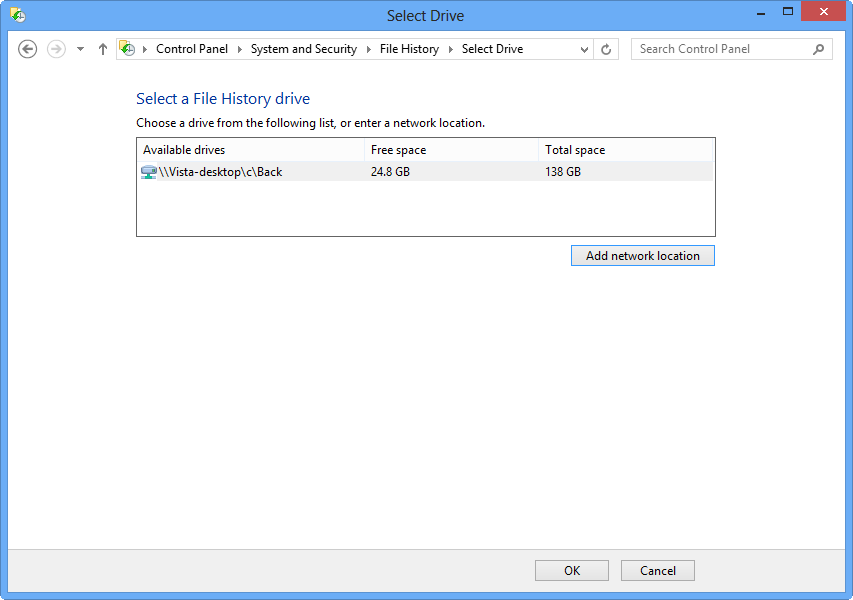
Select the disk you want to use for storing files for File History and then click “Turn on.” If you instead want to use a network location, click “Use network location,” then from the screen that appears click, “Add network location,” and browse to and select the location you want to use. During that process, you can also create a new folder on your network to be your backup location (Figure 4-19). Click Select Folder when you’ve chosen the location.
Note
Note: You can only add network locations on devices to which you have access.
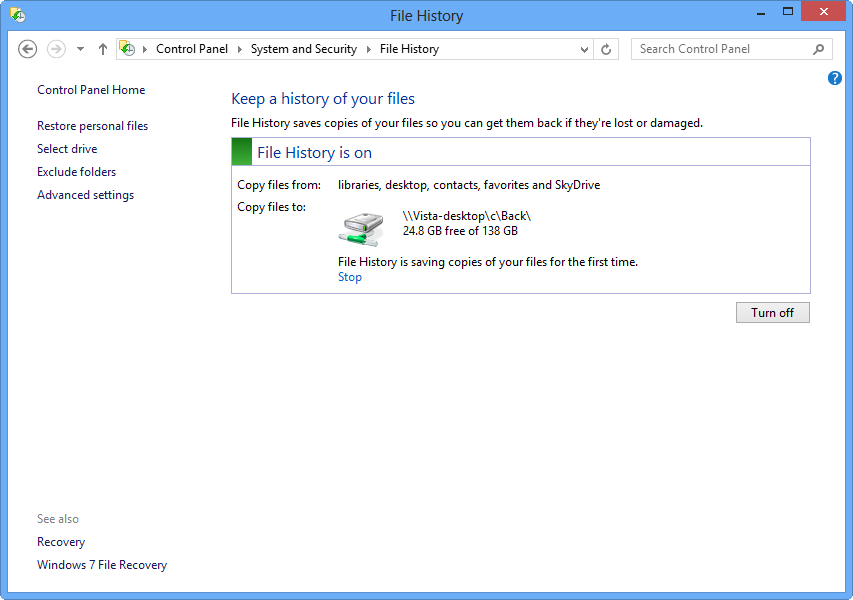
Once you’ve chosen the location to backup your files, whether it’s on a disk or network location, click “Turn on.” When you do, a screen asks whether you want to tell other members of your Homegroup network about this location. In that way, everyone on the network can use a common backup location. Click Yes to notify them, and No not to. After that, you’ll be sent back to the File History screen, shown in Figure 4-20. File History immediately sets to work, and begins backing up your files.
When you come back here again, you’ll see a notification telling you when the last time File History backed up your files was. You can also tell File History to back up your files right then by clicking the Run Now link. If you want to exclude any folders, click the “Exclude folders” link, select the folders you want excluded, and File History won’t back them up.
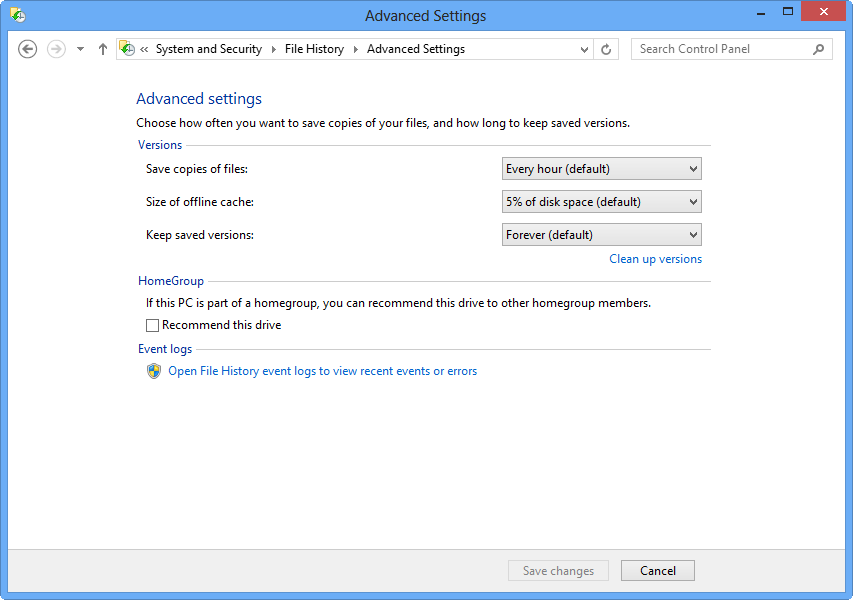
You’ve got plenty of options for changing the way that File History works (Figure 4-21). Click “Advanced settings” to change the following settings:
- Save copies of files
Lets you set how frequently your files are saved. The default is every hour, but you can select any time between every ten minutes to daily.
- Size of offline cache
File History uses a cache on your system disk to replicate your backups. This cache can be sizable, but this option lets you limit the size. The default size is 5% of the disk, but you can change that to be as low as 2% or as high as 20%.
- Keep saved versions
How long do you want to save the versions of your files? The default is forever. That can take up a substantial amount of disk space, so you can also set limits on how long to keep them. Your choices are between one month and two years, and forever. You can also select “Until space is needed,” as a way to balance your need for old files versus your need for disk space.
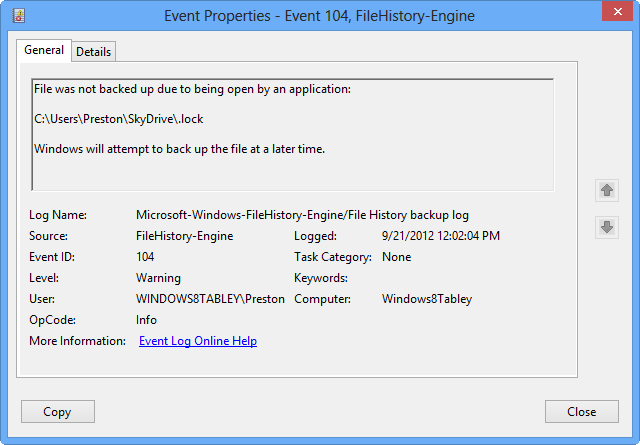
Also notable on this screen is the “Open File History events logs to view recent events or errors” link. Click it and you’ll open the Windows 8 Event Viewer, which reports on any issues File History might have had. When File Viewer opens, you’ll see some details about it. Click the event to see even more details, as shown in Figure 4-22.
To recover files with File History, go to the File History screen and click “Restore personal files,” or launch File Explorer and click History on the Home tab. It makes much more sense to use the File Explorer way to restore files, because you can first head right to the folder where you want to either recover deleted files or recover a previous version of an existing file. In Figure 4-23, you can see what File History looks like when accessed this way.
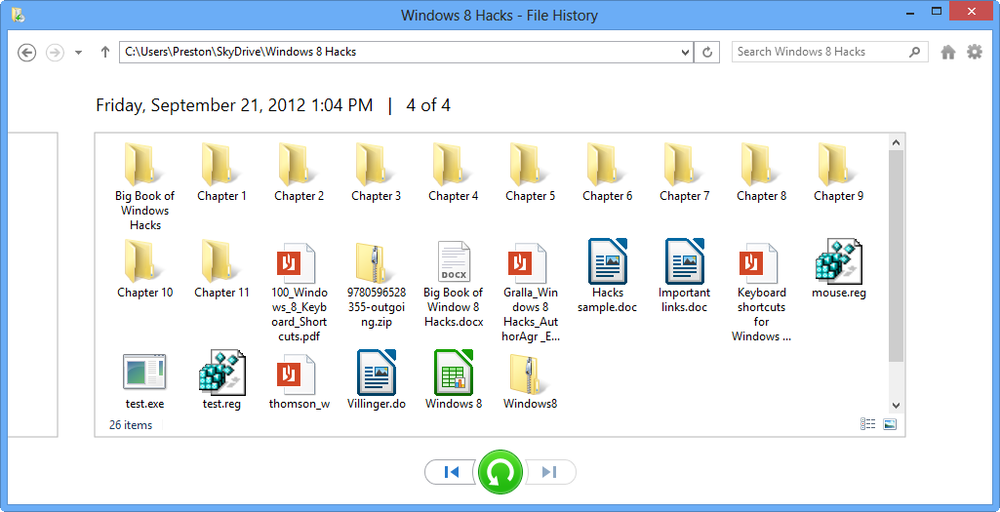
You’ll see the most recent versions of your files. You can navigate from here much the same way you do in File Explorer—double-click folders to drill down, click the up arrow at the address bar to move up a folder, and type an address into the address bar to go to a specific folder.
Much more interesting is the bottom of the screen. There, you’ll find a way to go back in time to see previous versions of the files and folders—and restore them. Click the back button to go back in time; when you’re back in time, click the forward button to go forward in time. You see the date and time the folder or file was backed up at the top of each screen. There’s also a pair of numbers, like “4 of 4.” That means that there are total of four versions of the file or folder, and you’re looking at the most recent version.
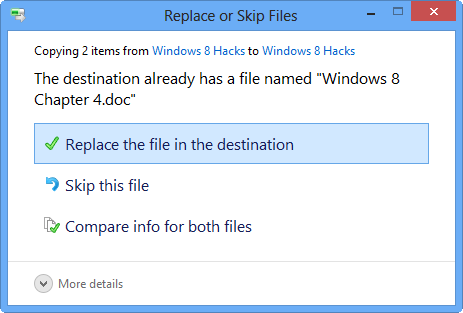
Recovering a file or folder is simple. Navigate to what you want to recover and click the green button. What you’ll see depends on whether you’ve highlighted a file or folder that’s been deleted, or for which you have a later version. Figure 4-24 shows what happens when you’re clicking an older version of an existing file. In that case, you can replace the newer file with the older one, skip the file and do nothing, or compare information about the two files to see which you want to keep. In that case, click “Compare info for both files” and a screen like the one in Figure 4-25 appears, showing basic details about each file. You can then decide which to keep.
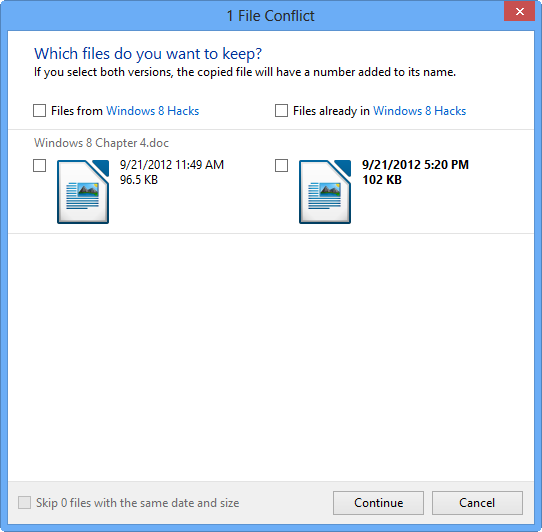
But what if you want to keep both files—the old and the new? Instead of clicking the green button, right-click the file (or folder), and from the screen that appears, select “Restore to.” You can then restore the file to a different location than the current file; that way, you’ll be able to have both files. In addition, when you right-click, you can instead preview the file by first selecting Preview.
See Also
This little-used tool can help fix problems with your Windows 8 device, including ones you never even knew you had.
As you can see in this chapter, Windows 8 includes plenty of tools
for juicing performance and troubleshooting problems. You’ve likely
overlooked one called the Action Center, but it’s worth visiting; see
Figure 4-26. To run it, type
Action at the Start screen, highlight settings, and
click the “Action Center” icon that appears.
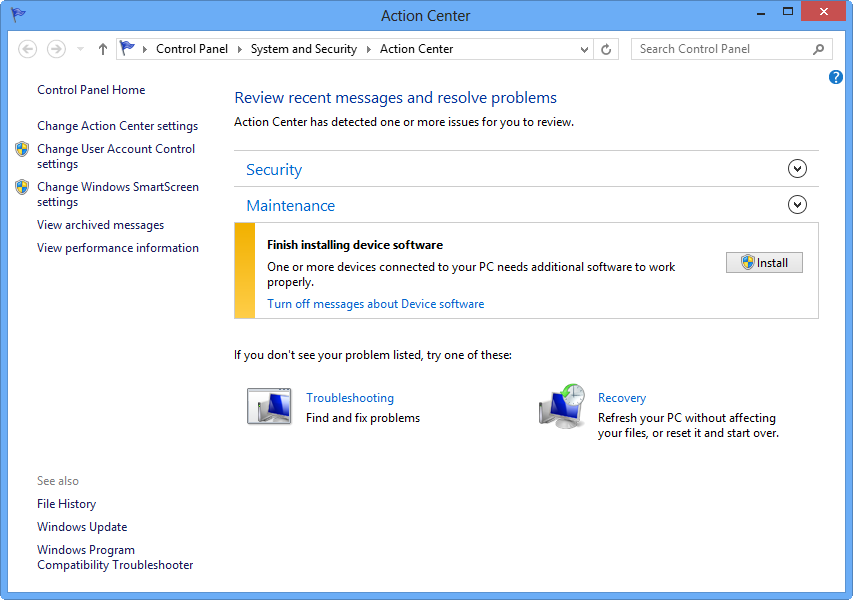
Using the Action Center is exceptionally easy and intuitive. Click Troubleshooting to track down any problems with your PC, and click Recovery to refresh your PC with a quick reinstall of Windows ([Hack #5]). Pay attention to the Maintenance area, because it’ll prod you to take actions you may have missed. For example, on my Windows 8 PC, I hadn’t realized that a proper device driver wasn’t installed, and the Maintenance section prompted me with a nice clear Install button. Click the down arrow next to it, and you’ll find a variety of links to various maintenance tools, as you can see in Figure 4-27.
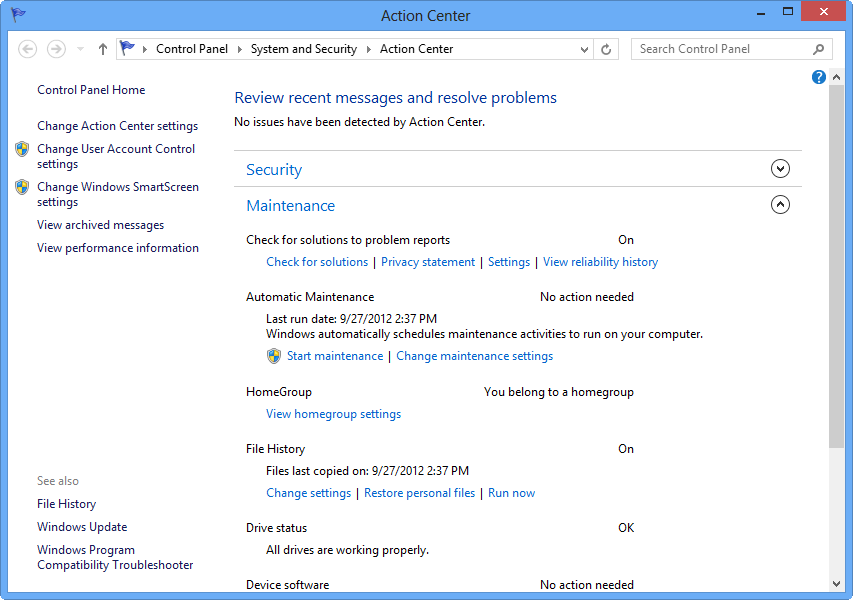
There are also links for checking your security, looking at old messages from the Action Center, and more. Take a few minutes to check them out. Your PC will thank you.
See Also
Here’s a great, little-known tool for tracking down system performance issues and helping resolve them.
As you use your PC, Windows 8 records an astonishing amount of information. Memory usage, network usage, system startup, application crashes, system slowdowns: all that and far more is captured in mind-boggling detail.
A well hidden system tool, Event Viewer, lets you get at all that information so that you can see what caused any problems you’re having. Based on that, you may be able to fix them.
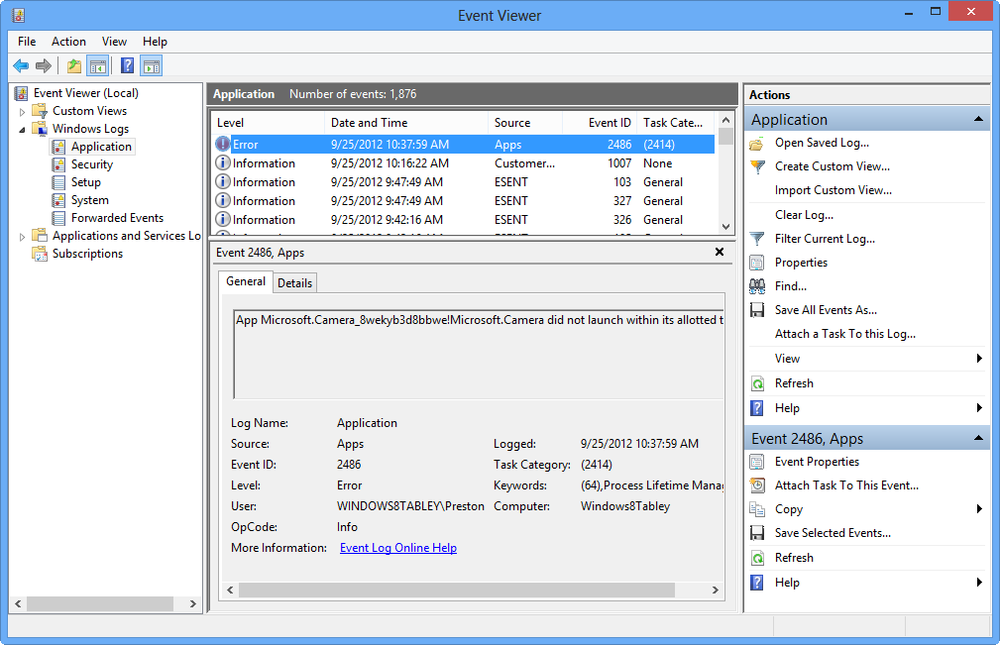
Launch it by typing Event Viewer at the Start screen and clicking its icon. (You can also right-click the lower-left portion of your screen and select Event Viewer from the pop-up menu.) The Event Viewer (Figure 4-28) launches; it lets you read a wide variety of Windows 8 system logs and data.
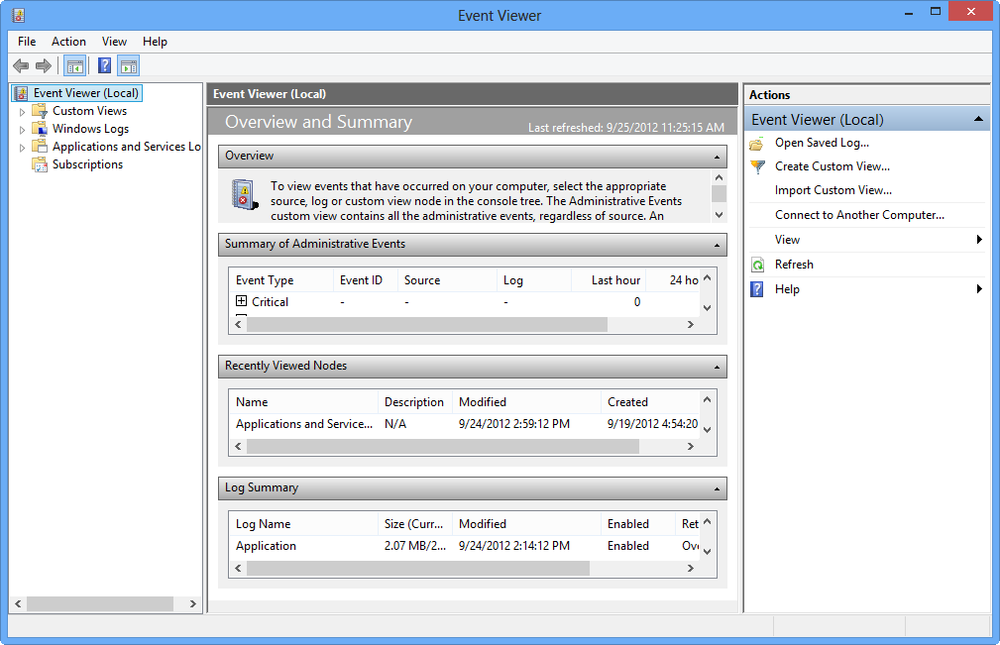
The Event Viewer is an exceedingly complex application with a wide variety of uses, and a full explanation of it is beyond the scope of this book. So what follows are some of the most important ways to use it to track system performance.
In the left pane, click Windows Logs. A variety of subfolders appear, including Applications, Security, Setup, System, and Forwarded Events. The most important of these from a performance point of view are Applications and System, so scroll through them.
When you click either subfolder, you’ll see a list of events that happened on your PC—for example, an app crashed, files were backed up, and so on. Mostly, these are purely informational, and frequently, you won’t be able to understand much about the event. Events that are normal, and in which no problems were recorded, have a blue icon of the letter i.
Problematic events have other icons, and as you scroll through the subfolders, look for these icons. A yellow warning icon indicates a problem of some sort, although not a severe one. A red warning, shown in Figure 4-29, indicates a more severe issue.
The Applications and Services Log’s top-level folder is where most of the action is if you’re interested in system performance. Beneath it, you’ll find a variety of subfolders. The most important subfolder of all is the Microsoft\Windows subfolder, which has far, far more information than the main Windows Log. You’ll find dozens of subfolders underneath Microsoft\Windows, and each of these has subfolders, often multiple ones.
Most of the subfolders are self-explanatory. Want to see how the Windows Defender anti-malware app is doing? Head to the Windows Defender subfolder. There are also subfolders for many other Windows services.
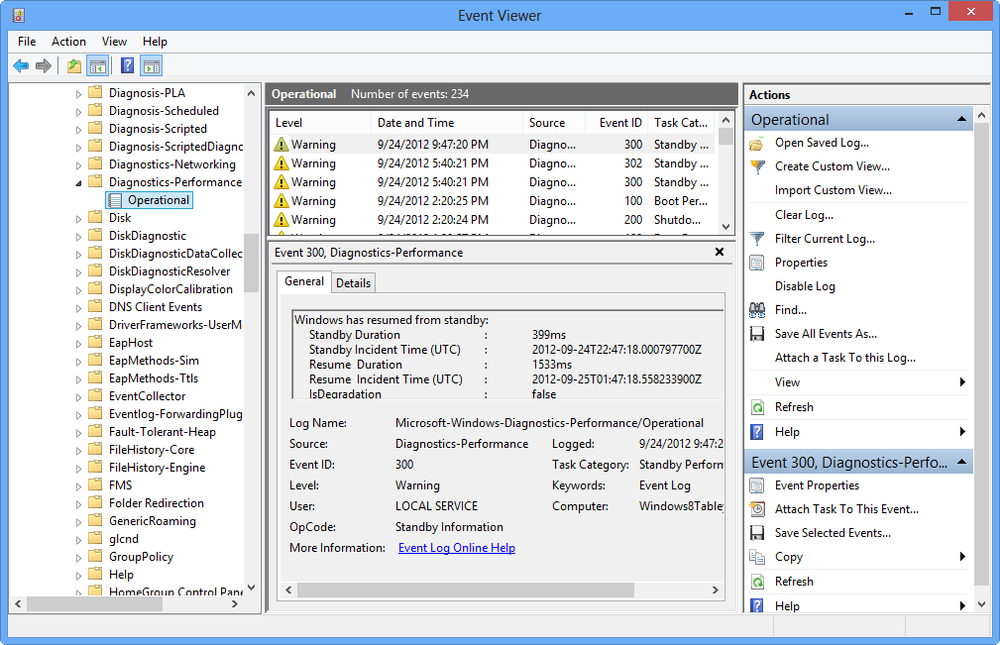
Most useful of all, from a performance standpoint, is the Diagnostics-Performance subfolder. Click to expand it, then click the Operational page (Figure 4-30). This page contains information about system performance, and reports on overall system problems and slowdowns. An event with a red exclamation point means there was a serious error; one with a red X means the error was a critical one.
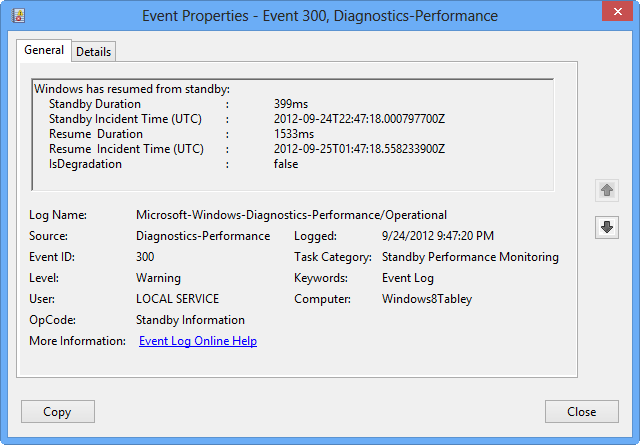
Scroll through all the errors and warnings. For more detail about any one of them, double-click it, and an Event Properties screen like that shown in Figure 4-31 appears, showing you the details in an easier-to-read format.
As you scroll through the page, look for patterns among the problems. Does a particular application seem to cause issues frequently? If so, consider uninstalling it or upgrading to the latest version, if one is available. Does the problem happen at a certain time of the day? If so, think of what you do on your PC at that time; do you run too many programs at once then?
The Event Viewer won’t actually be able to solve problems for you or speed up your system. But by viewing its logs, as outlined in this hack, it can help you see where you have performance issues, and you can take it from there.
See Also
Microsoft Office can cost a bundle. Here’s how to find similar productivity suites for free.
The cost of a new computer can be misleading, because that price includes only the hardware. Generally, you’ll have to pay for productivity software, notably Microsoft Office, and that can cost a bundle.
But you needn’t spend that much money, or any money at all. You can instead use free, downloadable alternatives. They might not have all the bells and whistles of Microsoft Office, but they’ll likely have everything you need. And they also will write and read files created with Microsoft Office, so you’ll still be able to use the worldwide standards for files, such as .docx, .doc, .xls, and so on.
This free open-source suite is my favorite of all alternatives to Microsoft Office. It does most things I need—and probably that you’ll need. In fact, I used LibreOffice to write significant portions of this book. It includes a word processor, spreadsheet, presentation program, drawing program, database, and math program.
This free, open source suite is the forerunner to LibreOffice—LibreOffice is based on it. It has the same set of apps as LibreOffice. I don’t find it as useful as LibreOffice, but as the saying goes, your mileage may vary.
If you’ve got a Google account, you’ve got access to Google Docs, a set of productivity apps designed to work in the cloud on Google Drive. You’ll find apps for word processing, spreadsheets, presentations, drawings, and forms. I don’t like the interface as much as LibreOffice, and find it doesn’t include all of LibreOffice’s features. Also, it’s designed for cloud computing rather than offline work. But if you collaborate with others, it’s the best suite for you.
Yes, Microsoft does offer this free alternative to Microsoft Office. It’s web-based, so you’ll need to be connected to the Internet to use it. It has Web versions of Word, Excel, PowerPoint, and OneNote and connects to SkyDrive. It does have some drawbacks, including that not all apps can create documents, and sometimes can only edit them. Get to it via SkyDrive or here.
Here’s another Web-based office suite, with a word processor, presentation software, spreadsheet, calendar, online organizer, and plenty more. There are also a variety of higher-level business apps—some for free, some for pay. I prefer Google Docs or Microsoft Office Web apps, but if you need higher-level apps, this is a good place to turn. Get it here.
Get Windows 8 Hacks now with the O’Reilly learning platform.
O’Reilly members experience books, live events, courses curated by job role, and more from O’Reilly and nearly 200 top publishers.

