
In June 2021, we asked the recipients of our Data & AI Newsletter to respond to a survey about compensation. The results gave us insight into what our subscribers are paid, where they’re located, what industries they work for, what their concerns are, and what sorts of career development opportunities they’re pursuing.
While it’s sadly premature to say that the survey took place at the end of the COVID-19 pandemic (though we can all hope), it took place at a time when restrictions were loosening: we were starting to go out in public, have parties, and in some cases even attend in-person conferences. The results then provide a place to start thinking about what effect the pandemic had on employment. There was a lot of uncertainty about stability, particularly at smaller companies: Would the company’s business model continue to be effective? Would your job still be there in a year? At the same time, employees were reluctant to look for new jobs, especially if they would require relocating—at least according to the rumor mill. Were those concerns reflected in new patterns for employment?
Executive Summary
- The average salary for data and AI professionals who responded to the survey was $146,000.
- The average change in compensation over the last three years was $9,252. This corresponds to an annual increase of 2.25%. However, 8% of the correspondents reported decreased compensation, and 18% reported no change.
- We don’t see evidence of a “great resignation.” 22% of respondents said they intended to change jobs, roughly what we would have expected. Respondents seemed concerned about job security, probably because of the pandemic’s effect on the economy.
- Average compensation was highest in California ($176,000), followed by Eastern Seaboard states like New York and Massachusetts.
- Compensation for women was significantly lower than for men (84%). Salaries were lower regardless of education or job title. Women were more likely than men to have advanced degrees, particularly PhDs.
- Many respondents acquired certifications. Cloud certifications, specifically in AWS and Microsoft Azure, were most strongly associated with salary increases.
- Most respondents participated in training of some form. Learning new skills and improving old ones were the most common reasons for training, though hireability and job security were also factors. Company-provided training opportunities were most strongly associated with pay increases.
Demographics
The survey was publicized through O’Reilly’s Data & AI Newsletter and was limited to respondents in the United States and the United Kingdom. There were 3,136 valid responses, 2,778 from the US and 284 from the UK. This report focuses on the respondents from the US, with only limited attention paid to those from the UK. A small number of respondents (74) identified as residents of the US or UK, but their IP addresses indicated that they were located elsewhere. We didn’t use the data from these respondents; in practice, discarding this data had no effect on the results.
Of the 2,778 US respondents, 2,225 (81%) identified as men, and 383 (14%) identified as women (as identified by their preferred pronouns). 113 (4%) identified as “other,” and 14 (0.5%) used “they.”
The results are biased by the survey’s recipients (subscribers to O’Reilly’s Data & AI Newsletter). Our audience is particularly strong in the software (20% of respondents), computer hardware (4%), and computer security (2%) industries—over 25% of the total. Our audience is also strong in the states where these industries are concentrated: 42% of the US respondents lived in California (20%), New York (9%), Massachusetts (6%), and Texas (7%), though these states only make up 27% of the US population.
Compensation Basics
The average annual salary for employees who worked in data or AI was $146,000. Most salaries were between $100,000 and $150,000 yearly (34%); the next most common salary tier was from $150,000 to $200,000 (26%). Compensation depended strongly on location, with average salaries highest in California ($176,000).
The average salary change over the past three years was $9,252, which is 2.25% per year (assuming a final salary equal to the average). A small number of respondents (8%) reported salary decreases, and 18% reported no change. Economic uncertainty caused by the pandemic may be responsible for the declines in compensation. 19% reported increases of $5,000 to $10,000 over that period; 14% reported increases of over $25,000. A study by the IEEE suggests that the average salary for technical employees increased 3.6% per year, higher than our respondents indicated.
39% of respondents reported promotions in the past three years, and 37% reported changing employers during that period. 22% reported that they were considering changing jobs because their salaries hadn’t increased during the past year. Is this a sign of what some have called a “great resignation”? Common wisdom has it that technical employees change jobs every three to four years. LinkedIn and Indeed both recommend staying for at least three years, though they observe that younger employees change jobs more often. LinkedIn elsewhere states that the annual turnover rate for technology employees is 13.2%—which suggests that employees stay at their jobs for roughly seven and a half years. If that’s correct, the 37% that changed jobs over three years seems about right, and the 22% who said they “intend to leave their job due to a lack of compensation increase” doesn’t seem overly high. Keep in mind that intent to change and actual change are not the same—and that there are many reasons to change jobs aside from salary, including flexibility around working hours and working from home.
64% of the respondents took part in training or obtained certifications in the past year, and 31% reported spending over 100 hours in training programs, ranging from formal graduate degrees to reading blog posts. As we’ll see later, cloud certifications (specifically in AWS and Microsoft Azure) were the most popular and appeared to have the largest effect on salaries.
The reasons respondents gave for participating in training were surprisingly consistent. The vast majority reported that they wanted to learn new skills (91%) or improve existing skills (84%). Data and AI professionals are clearly interested in learning—and that learning is self-motivated, not imposed by management. Relatively few (22%) said that training was required by their job, and even fewer participated in training because they were concerned about losing their job (9%).
However, there were other motives at work. 56% of our respondents said that they wanted to increase their “job security,” which is at odds with the low number who were concerned about losing their job. And 73% reported that they engaged in training or obtained certifications to increase their “hireability,” which may suggest more concern about job stability than our respondents would admit. The pandemic was a threat to many businesses, and employees were justifiably concerned that their job could vanish after a bad pandemic-influenced quarter. A desire for increased hireability may also indicate that we’ll see more people looking to change jobs in the near future.
Finally, 61% of the respondents said that they participated in training or earned certifications because they wanted a salary increase or a promotion (“increase in job title/responsibilities”). It isn’t surprising that employees see training as a route to promotion—especially as companies that want to hire in fields like data science, machine learning, and AI contend with a shortage of qualified employees. Given the difficulty of hiring expertise from outside, we expect an increasing number of companies to grow their own ML and AI talent internally using training programs.
Salaries by Gender
To nobody’s surprise, our survey showed that data science and AI professionals are mostly male. The number of respondents tells the story by itself: only 14% identified as women, which is lower than we’d have guessed, though it’s roughly consistent with our conference attendance (back when we had live conferences) and roughly equivalent to other technical fields. A small number (5%) reported their preferred pronoun as “they” or Other, but this sample was too small to draw any significant comparisons about compensation.
Women’s salaries were sharply lower than men’s salaries, averaging $126,000 annually, or 84% of the average salary for men ($150,000). That differential held regardless of education, as Figure 1 shows: the average salary for a woman with a doctorate or master’s degree was 82% of the salary for a man with an equivalent degree. The difference wasn’t quite as high for people with bachelor’s degrees or who were still students, but it was still significant: women with bachelor’s degrees or who were students earned 86% or 87% of the average salary for men. The difference in salaries was greatest between people who were self-taught: in that case, women’s salaries were 72% of men’s. An associate’s degree was the only degree for which women’s salaries were higher than men’s.
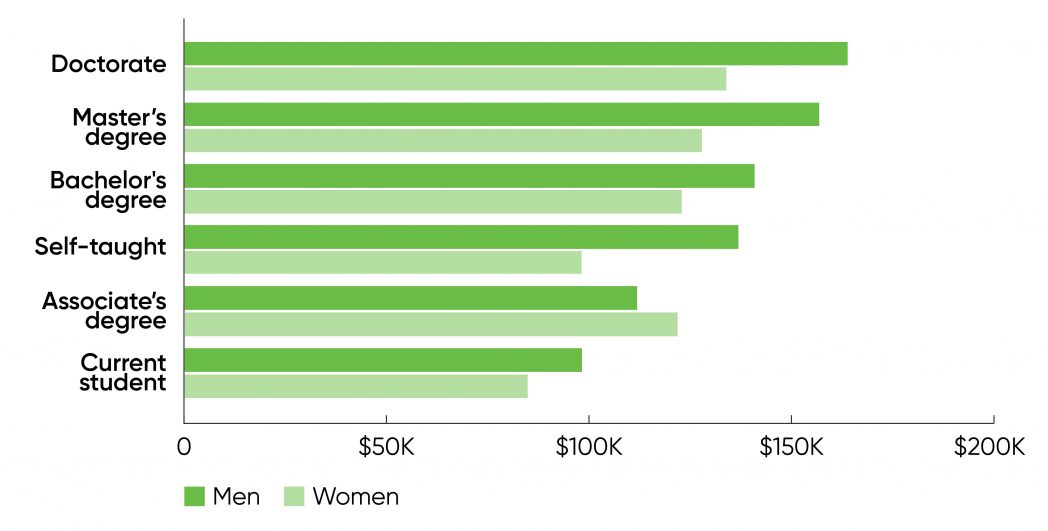
Despite the salary differential, a higher percentage of women had advanced degrees than men: 16% of women had a doctorate, as opposed to 13% of men. And 47% of women had a master’s degree, as opposed to 46% of men. (If those percentages seem high, keep in mind that many professionals in data science and AI are escapees from academia.)
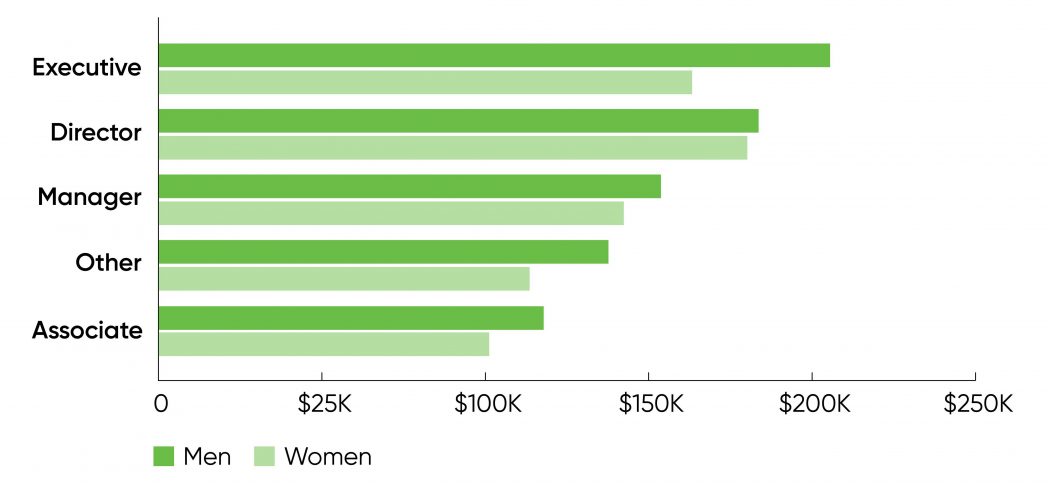
Women’s salaries also lagged men’s salaries when we compared women and men with similar job titles (see Figure 2). At the executive level, the average salary for women was $163,000 versus $205,000 for men (a 20% difference). At the director level, the difference was much smaller—$180,000 for women versus $184,000 for men—and women’s salaries were actually higher than those at the executive level. It’s easy to hypothesize about this difference, but we’re at a loss to explain it. For managers, women’s salaries were $143,000 versus $154,000 for men (a 7% difference).
Career advancement is also an issue: 18% of the women who participated in the survey were executives or directors, compared with 23% of the men.
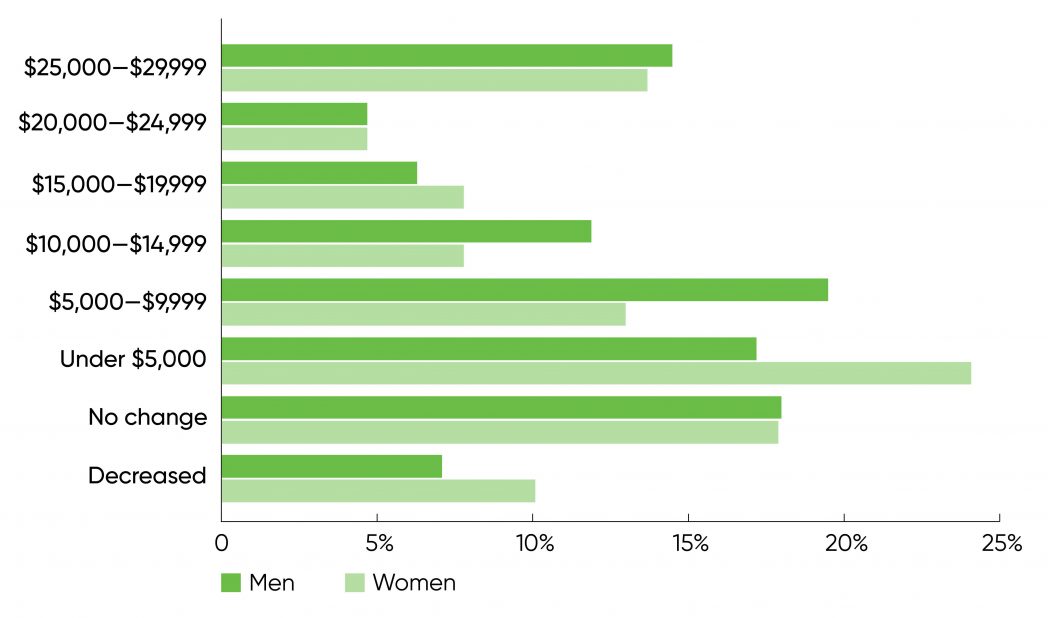
Before moving on from our consideration of the effect of gender on salary, let’s take a brief look at how salaries changed over the past three years. As Figure 3 shows, the percentage of men and women respondents who saw no change was virtually identical (18%). But more women than men saw their salaries decrease (10% versus 7%). Correspondingly, more men saw their salaries increase. Women were also more likely to have a smaller increase: 24% of women had an increase of under $5,000 versus 17% of men. At the high end of the salary spectrum, the difference between men and women was smaller, though still not zero: 19% of men saw their salaries increase by over $20,000, but only 18% of women did. So the most significant differences were in the midrange. One anomaly sticks out: a slightly higher percentage of women than men received salary increases in the $15,000 to $20,000 range (8% versus 6%).
Salaries by Programming Language
When we looked at the most popular programming languages for data and AI practitioners, we didn’t see any surprises: Python was dominant (61%), followed by SQL (54%), JavaScript (32%), HTML (29%), Bash (29%), Java (24%), and R (20%). C++, C#, and C were further back in the list (12%, 12%, and 11%, respectively).
Discussing the connection between programming languages and salary is tricky because respondents were allowed to check multiple languages, and most did. But when we looked at the languages associated with the highest salaries, we got a significantly different list. The most widely used and popular languages, like Python ($150,000), SQL ($144,000), Java ($155,000), and JavaScript ($146,000), were solidly in the middle of the salary range. The outliers were Rust, which had the highest average salary (over $180,000), Go ($179,000), and Scala ($178,000). Other less common languages associated with high salaries were Erlang, Julia, Swift, and F#. Web languages (HTML, PHP, and CSS) were at the bottom (all around $135,000). See Figure 4 for the full list.
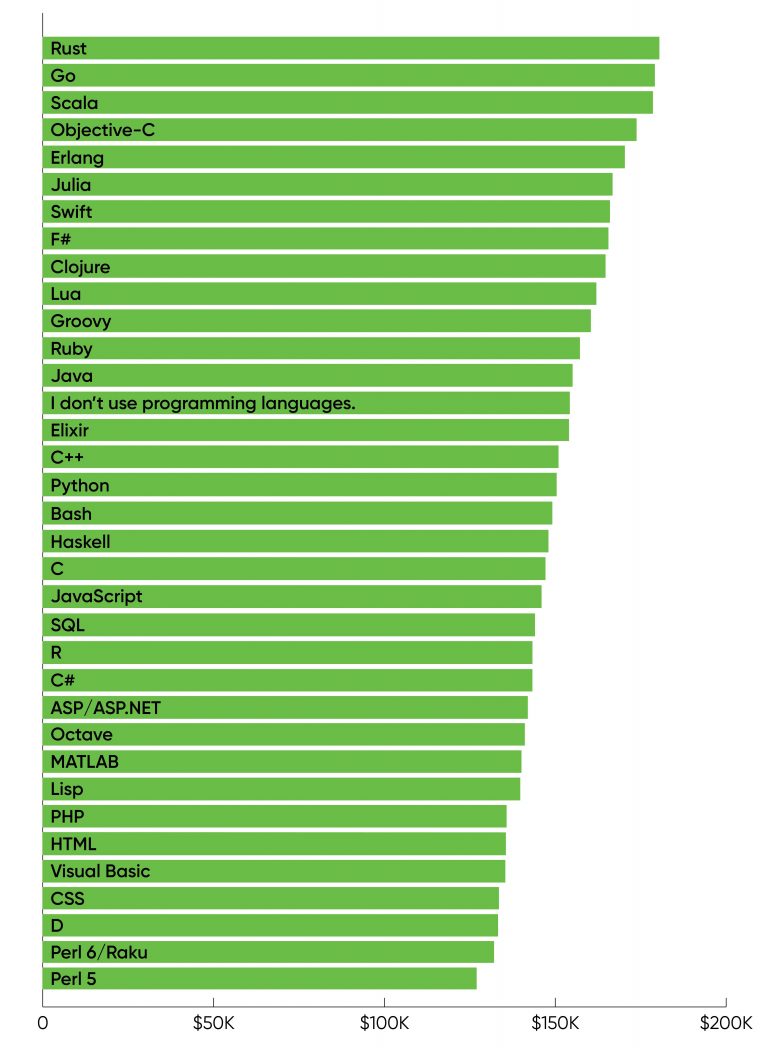
How do we explain this? It’s difficult to say that data and AI developers who use Rust command a higher salary, since most respondents checked several languages. But we believe that this data shows something significant. The supply of talent for newer languages like Rust and Go is relatively small. While there may not be a huge demand for data scientists who use these languages (yet), there’s clearly some demand—and with experienced Go and Rust programmers in short supply, they command a higher salary. Perhaps it is even simpler: regardless of the language someone will use at work, employers interpret knowledge of Rust and Go as a sign of competence and willingness to learn, which increases candidates’ value. A similar argument can be made for Scala, which is the native language for the widely used Spark platform. Languages like Python and SQL are table stakes: an applicant who can’t use them could easily be penalized, but competence doesn’t confer any special distinction.
One surprise is that 10% of the respondents said that they didn’t use any programming languages. We’re not sure what that means. It’s possible they worked entirely in Excel, which should be considered a programming language but often isn’t. It’s also possible that they were managers or executives who no longer did any programming.
Salaries by Tool and Platform
We also asked respondents what tools they used for statistics and machine learning and what platforms they used for data analytics and data management. We observed some of the same patterns that we saw with programming languages. And the same caution applies: respondents were allowed to select multiple answers to our questions about the tools and platforms that they use. (However, multiple answers weren’t as frequent as for programming languages.) In addition, if you’re familiar with tools and platforms for machine learning and statistics, you know that the boundary between them is fuzzy. Is Spark a tool or a platform? We considered it a platform, though two Spark libraries are in the list of tools. What about Kafka? A platform, clearly, but a platform for building data pipelines that’s qualitatively different from a platform like Ray, Spark, or Hadoop.
Just as with programming languages, we found that the most widely used tools and platforms were associated with midrange salaries; older tools, even if they’re still widely used, were associated with lower salaries; and some of the tools and platforms with the fewest users corresponded to the highest salaries. (See Figure 5 for the full list.)
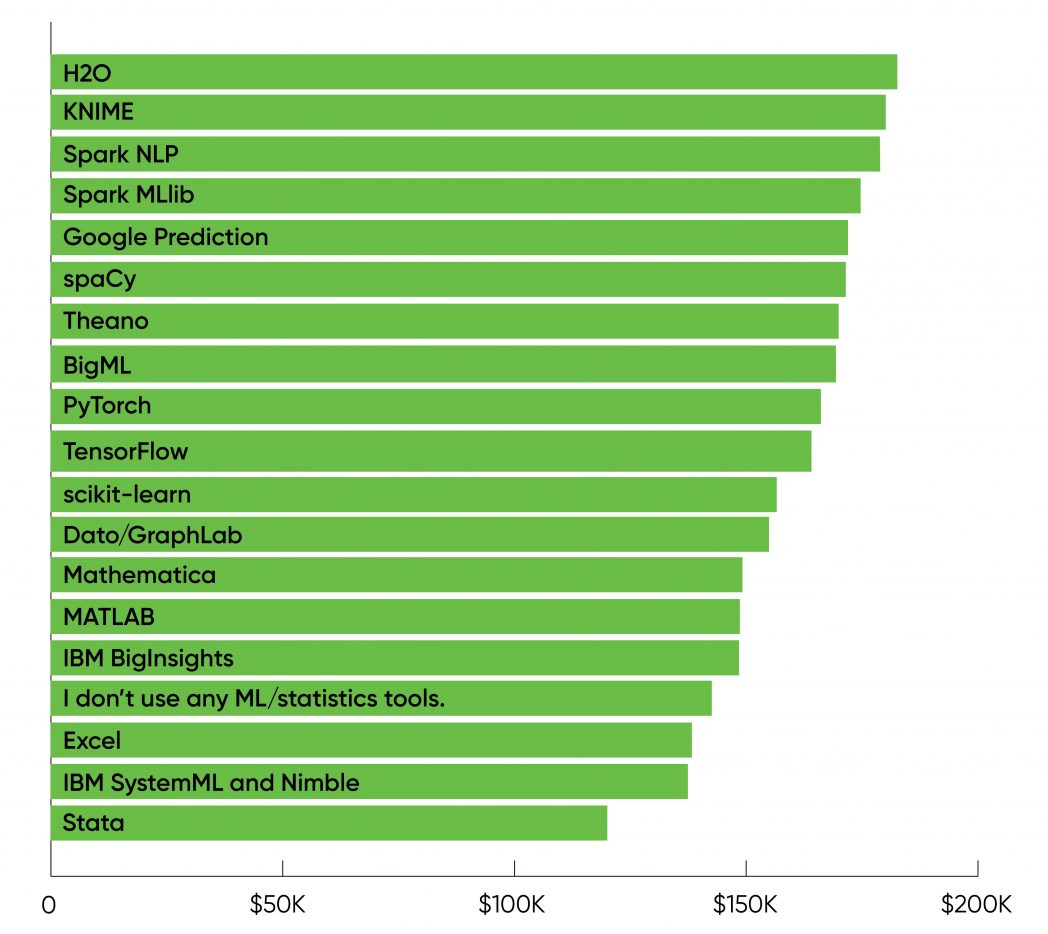
The most common responses to the question about tools for machine learning or statistics were “I don’t use any tools” (40%) or Excel (31%). Ignoring the question of how one does machine learning or statistics without tools, we’ll only note that those who didn’t use tools had an average salary of $143,000, and Excel users had an average salary of $138,000—both below average. Stata ($120,000) was also at the bottom of the list; it’s an older package with relatively few users and is clearly falling out of favor.
The popular machine learning packages PyTorch (19% of users, $166,000 average salary), TensorFlow (20%, $164,000), and scikit-learn (27%, $157,000) occupied the middle ground. Those salaries were above the average for all respondents, which was pulled down by the large numbers who didn’t use tools or only used Excel. The highest salaries were associated with H2O (3%, $183,000), KNIME (2%, $180,000), Spark NLP (5%, $179,000), and Spark MLlib (8%, $175,000). It’s hard to trust conclusions based on 2% or 3% of the respondents, but it appears that salaries are higher for people who work with tools that have a lot of “buzz” but aren’t yet widely used. Employers pay a premium for specialized expertise.
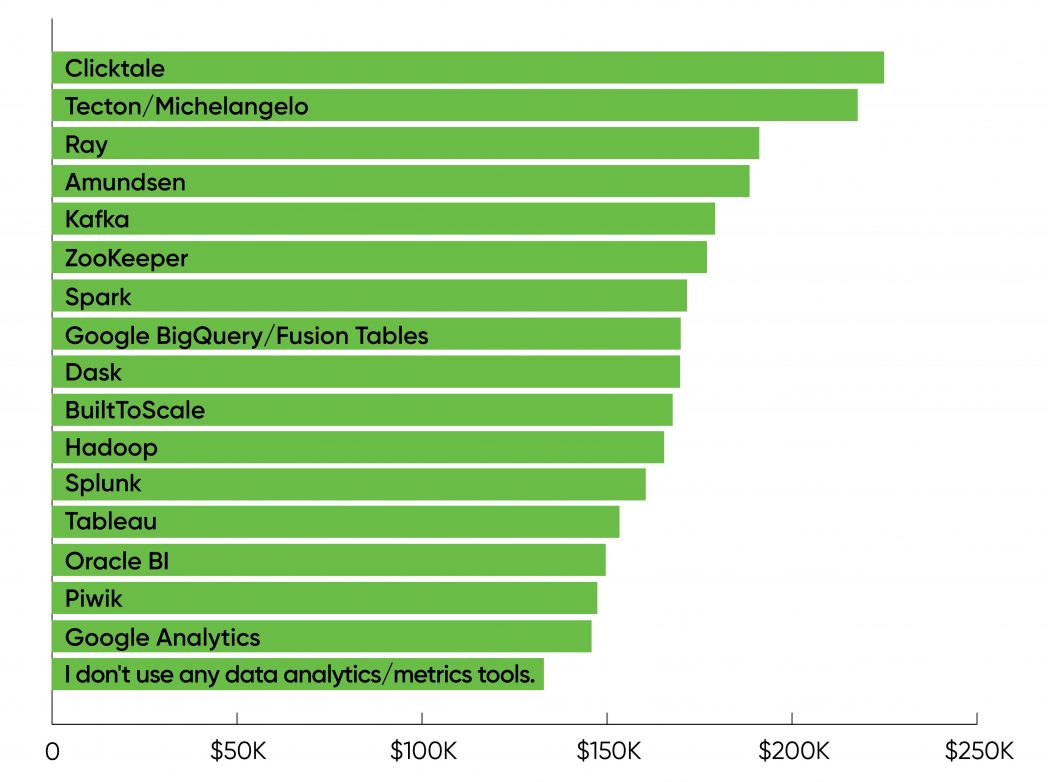
We see almost exactly the same thing when we look at data frameworks (Figure 6). Again, the most common response was from people who didn’t use a framework; that group also received the lowest salaries (30% of users, $133,000 average salary).
In 2021, Hadoop often seems like legacy software, but 15% of the respondents were working on the Hadoop platform, with an average salary of $166,000. That was above the average salary for all users and at the low end of the midrange for salaries sorted by platform.
The highest salaries were associated with Clicktale (now ContentSquare), a cloud-based analytics system for researching customer experience: only 0.2% of respondents use it, but they have an average salary of $225,000. Other frameworks associated with high salaries were Tecton (the commercial version of Michelangelo, at $218,000), Ray ($191,000), and Amundsen ($189,000). These frameworks had relatively few users—the most widely used in this group was Amundsen with 0.8% of respondents (and again, we caution against reading too much into results based on so few respondents). All of these platforms are relatively new, frequently discussed in the tech press and social media, and appear to be growing healthily. Kafka, Spark, Google BigQuery, and Dask were in the middle, with a lot of users (15%, 19%, 8%, and 5%) and above-average salaries ($179,000, $172,000, $170,000, and $170,000). Again, the most popular platforms occupied the middle of the range; experience with less frequently used and growing platforms commanded a premium.
Salaries by Industry
The greatest number of respondents worked in the software industry (20% of the total), followed by consulting (11%) and healthcare, banking, and education (each at 8%). Relatively few respondents listed themselves as consultants (also 2%), though consultancy tends to be cyclic, depending on current thinking on outsourcing, tax law, and other factors. The average income for consultants was $150,000, which is only slightly higher than the average for all respondents ($146,000). That may indicate that we’re currently in some kind of an equilibrium between consultants and in-house talent.
While data analysis has become essential to every kind of business and AI is finding many applications outside of computing, salaries were highest in the computer industry itself, as Figure 7 makes clear. For our purposes, the “computer industry” was divided into four segments: computer hardware, cloud services and hosting, security, and software. Average salaries in these industries ranged from $171,000 (for computer hardware) to $164,000 (for software). Salaries for the advertising industry (including social media) were surprisingly low, only $150,000.
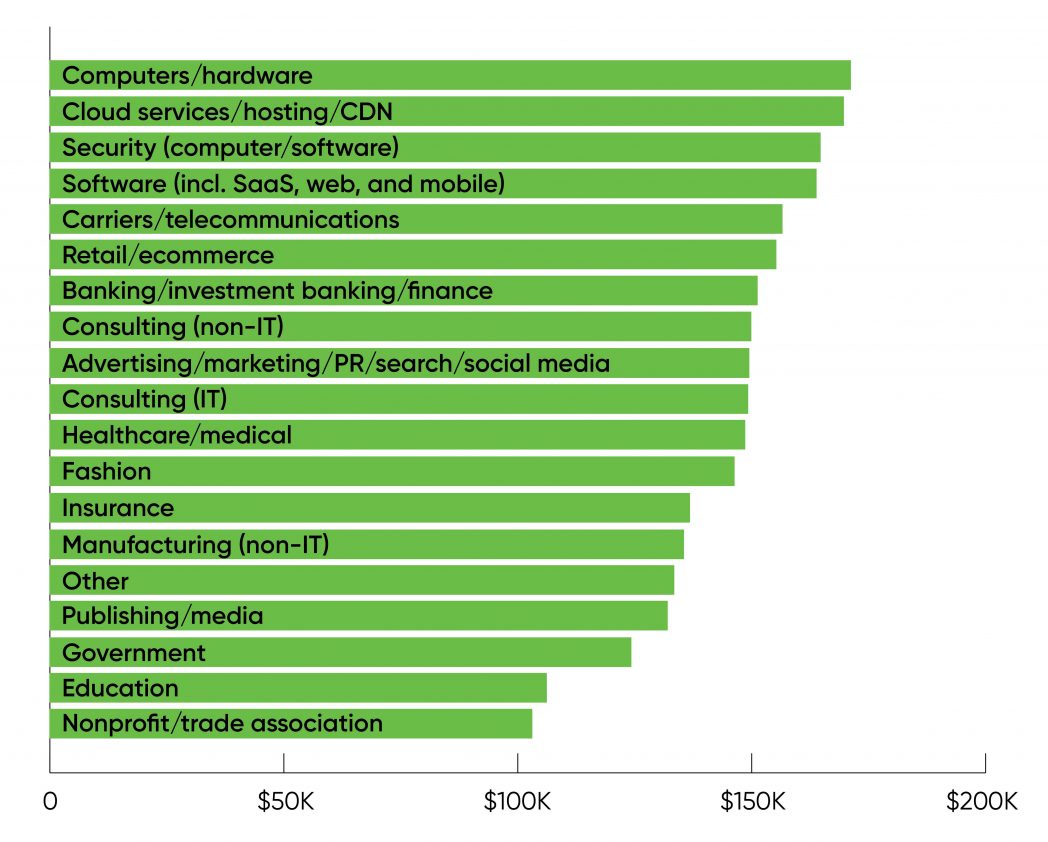
Education and nonprofit organizations (including trade associations) were at the bottom end of the scale, with compensation just above $100,000 ($106,000 and $103,000, respectively). Salaries for technical workers in government were slightly higher ($124,000).
Salaries by State
When looking at data and AI practitioners geographically, there weren’t any big surprises. The states with the most respondents were California, New York, Texas, and Massachusetts. California accounted for 19% of the total, with over double the number of respondents from New York (8%). To understand how these four states dominate, remember that they make up 42% of our respondents but only 27% of the United States’ population.
Salaries in California were the highest, averaging $176,000. The Eastern Seaboard did well, with an average salary of $157,000 in Massachusetts (second highest). New York, Delaware, New Jersey, Maryland, and Washington, DC, all reported average salaries in the neighborhood of $150,000 (as did North Dakota, with five respondents). The average salary reported for Texas was $148,000, which is slightly above the national average but nevertheless seems on the low side for a state with a significant technology industry.
Salaries in the Pacific Northwest were not as high as we expected. Washington just barely made it into the top 10 in terms of the number of respondents, and average salaries in Washington and Oregon were $138,000 and $133,000, respectively. (See Figure 8 for the full list.)
The highest-paying jobs, with salaries over $300,000, were concentrated in California (5% of the state’s respondents) and Massachusetts (4%). There were a few interesting outliers: North Dakota and Nevada both had very few respondents, but each had one respondent making over $300,000. In Nevada, we’re guessing that’s someone who works for the casino industry—after all, the origins of probability and statistics are tied to gambling. Most states had no respondents with compensation over $300,000.
The lowest salaries were, for the most part, from states with the fewest respondents. We’re reluctant to say more than that. These states typically had under 10 respondents, which means that averaging salaries is extremely noisy. For example, Alaska only had two respondents and an average salary of $75,000; Mississippi and Louisiana each only had five respondents, and Rhode Island only had three. In any of these states, one or two additional respondents at the executive level would have a huge effect on the states average. Furthermore, the averages in those states are so low that all (or almost all) respondents must be students, interns, or in entry-level positions. So we don’t think we can make any statement stronger than “the high paying jobs are where you’d expect them to be.”
Job Change by Salary
Despite the differences between states, we found that the desire to change jobs based on lack of compensation didn’t depend significantly on geography. There were outliers at both extremes, but they were all in states where the number of respondents was small and one or two people looking to change jobs would make a significant difference. It’s not terribly interesting to say that 24% of respondents from California intend to change jobs (only 2% above the national average); after all, you’d expect California to dominate. There may be a small signal from states like New York, with 232 respondents, of whom 27% intend to change jobs, or from a state like Virginia, with 137 respondents, of whom only 19% were thinking of changing. But again, these numbers aren’t much different from the total percentage of possible job changers.
If intent to change jobs due to compensation isn’t dependent on location, then what does it depend on? Salary. It’s not at all surprising that respondents with the lowest salaries (under $50,000/year) are highly motivated to change jobs (29%); this group is composed largely of students, interns, and others who are starting their careers. The group that showed the second highest desire to change jobs, however, had the highest salaries: over $400,000/year (27%). It’s an interesting pairing: those with the highest and lowest salaries were most intent on getting a salary increase.
26% of those with annual salaries between $50,000 and $100,000 indicated that they intend to change jobs because of compensation. For the remainder of the respondents (those with salaries between $100,000 and $400,000), the percentage who intend to change jobs was 22% or lower.
Salaries by Certification
Over a third of the respondents (37%) replied that they hadn’t obtained any certifications in the past year. The next biggest group replied “other” (14%), meaning that they had obtained certifications in the past year but not one of the certifications we listed. We allowed them to write in their own responses, and they shared 352 unique answers, ranging from vendor-specific certifications (e.g., DataRobot) to university degrees (e.g., University of Texas) to well-established certifications in any number of fields (e.g., Certified Information Systems Security Professional a.k.a. CISSP). While there were certainly cases where respondents used different words to describe the same thing, the amount of unique write-in responses reflects the great number of certifications available.
Cloud certifications were by far the most popular. The top certification was for AWS (3.9% obtained AWS Certified Solutions Architect-Associate), followed by Microsoft Azure (3.8% had AZ-900: Microsoft Azure Fundamentals), then two more AWS certifications and CompTIA’s Security+ certification (1% each). Keep in mind that 1% only represents 27 respondents, and all the other certifications had even fewer respondents.
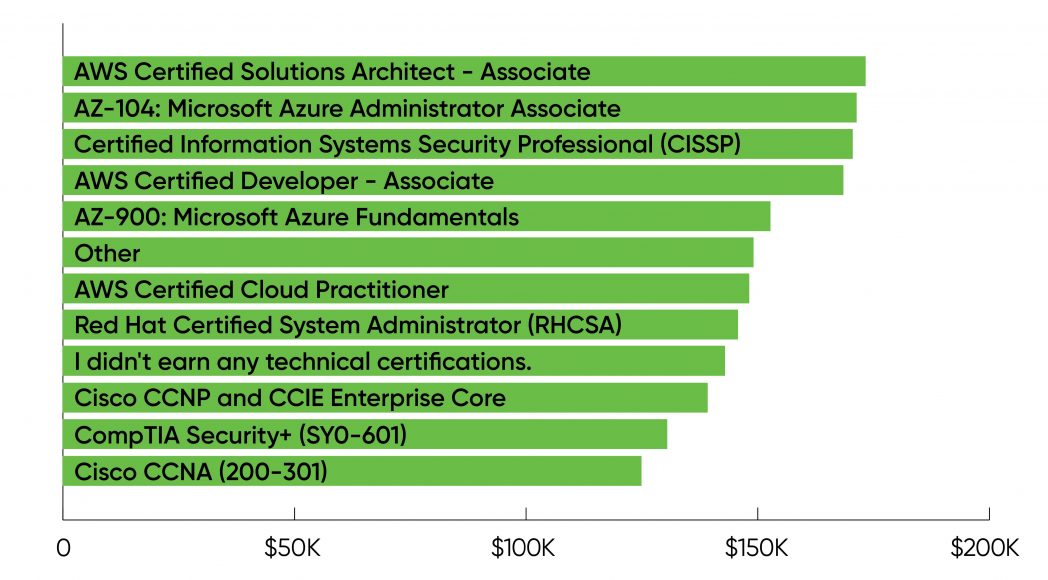
As Figure 9 shows, the highest salaries were associated with AWS certifications, the Microsoft AZ-104 (Azure Administrator Associate) certification, and the CISSP security certification. The average salary for people listing these certifications was higher than the average salary for US respondents as a whole. And the average salary for respondents who wrote in a certification was slightly above the average for those who didn’t earn any certifications ($149,000 versus $143,000).
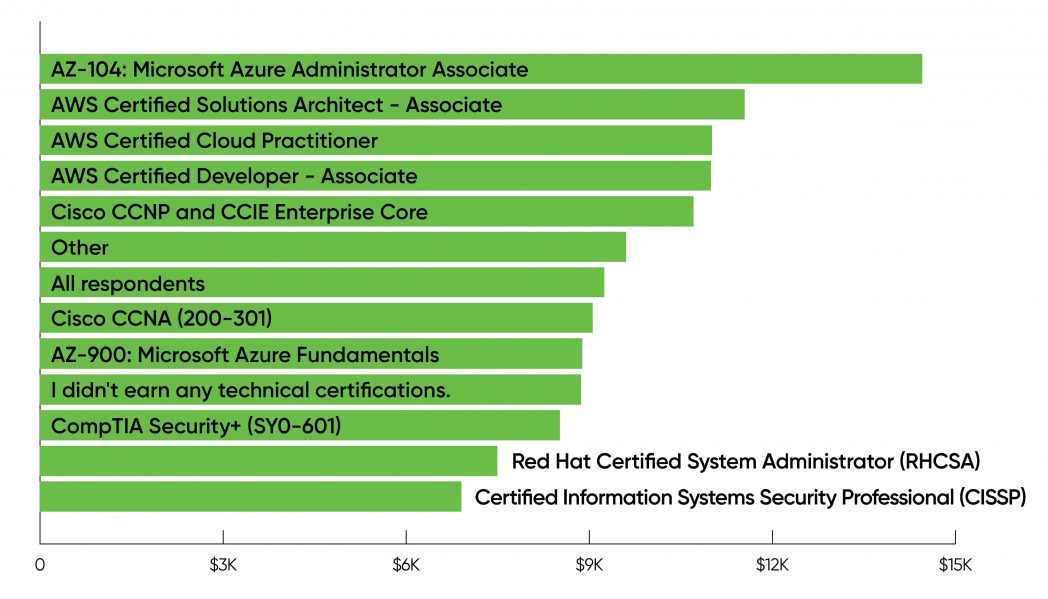
Certifications were also associated with salary increases (Figure 10). Again AWS and Microsoft Azure dominate, with Microsoft’s AZ-104 leading the way, followed by three AWS certifications. And on the whole, respondents with certifications appear to have received larger salary increases than those who didn’t earn any technical certifications.
Google Cloud is an obvious omission from this story. While Google is the third-most-important cloud provider, only 26 respondents (roughly 1%) claimed any Google certification, all under the “Other” category.
Among our respondents, security certifications were relatively uncommon and didn’t appear to be associated with significantly higher salaries or salary increases. Cisco’s CCNP was associated with higher salary increases; respondents who earned the CompTIA Security+ or CISSP certifications received smaller increases. Does this reflect that management undervalues security training? If this hypothesis is correct, undervaluing security is clearly a significant mistake, given the ongoing importance of security and the possibility of new attacks against AI and other data-driven systems.
Cloud certifications clearly had the greatest effect on salary increases. With very few exceptions, any certification was better than no certification: respondents who wrote in a certification under “Other” averaged a $9,600 salary increase over the last few years, as opposed to $8,900 for respondents who didn’t obtain a certification and $9,300 for all respondents regardless of certification.
Training
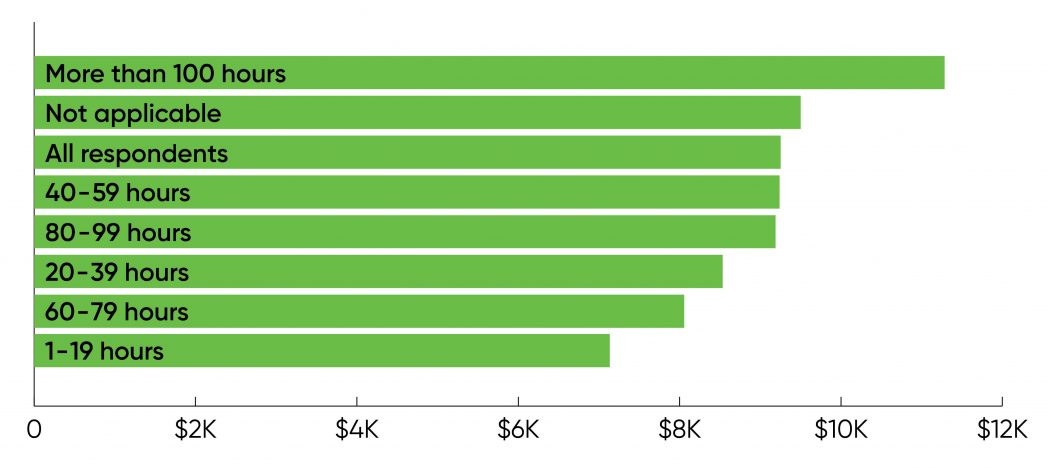
Participating in training resulted in salary increases—but only for those who spent more than 100 hours in a training program. As Figure 11 shows, those respondents had an average salary increase of $11,000. This was also the largest group of respondents (19%). Respondents who only reported undertaking 1–19 hours of training (8%) saw lower salary increases, with an average of $7,100. It’s interesting that those who participated in 1–19 hours of training saw smaller increases than those who didn’t participate in training at all. It doesn’t make sense to speculate about this difference, but the data does make one thing clear: if you engage in training, be serious about it.
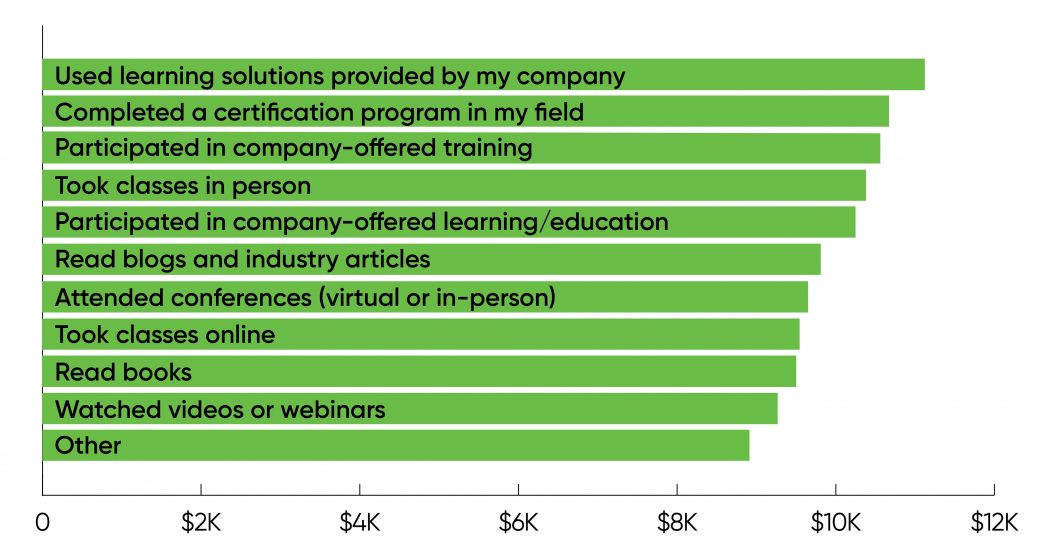
We also asked what types of training respondents engaged in: whether it was company provided (for which there were three alternatives), a certification program, a conference, or some other kind of training (detailed in Figure 12). Respondents who took advantage of company-provided opportunities had the highest average salaries ($156,000, $150,000, and $149,000). Those who obtained certifications were next ($148,000). The results are similar if we look at salary increases over the past three years: Those who participated in various forms of company-offered training received increases between $11,000 and $10,000. Salary increases for respondents who obtained a certification were in the same range ($11,000).
The Last Word
Data and AI professionals—a rubric under which we include data scientists, data engineers, and specialists in AI and ML—are well-paid, reporting an average salary just under $150,000. However, there were sharp state-by-state differences: salaries were significantly higher in California, though the Northeast (with some exceptions) did well.
There were also significant differences between salaries for men and women. Men’s salaries were higher regardless of job title, regardless of training and regardless of academic degrees—even though women were more likely to have an advanced academic degree (PhD or master’s degree) than were men.
We don’t see evidence of a “great resignation.” Job turnover through the pandemic was roughly what we’d expect (perhaps slightly below normal). Respondents did appear to be concerned about job security, though they didn’t want to admit it explicitly. But with the exception of the least- and most-highly compensated respondents, the intent to change jobs because of salary was surprisingly consistent and nothing to be alarmed at.
Training was important, in part because it was associated with hireability and job security but more because respondents were genuinely interested in learning new skills and improving current ones. Cloud training, particularly in AWS and Microsoft Azure, was the most strongly associated with higher salary increases.
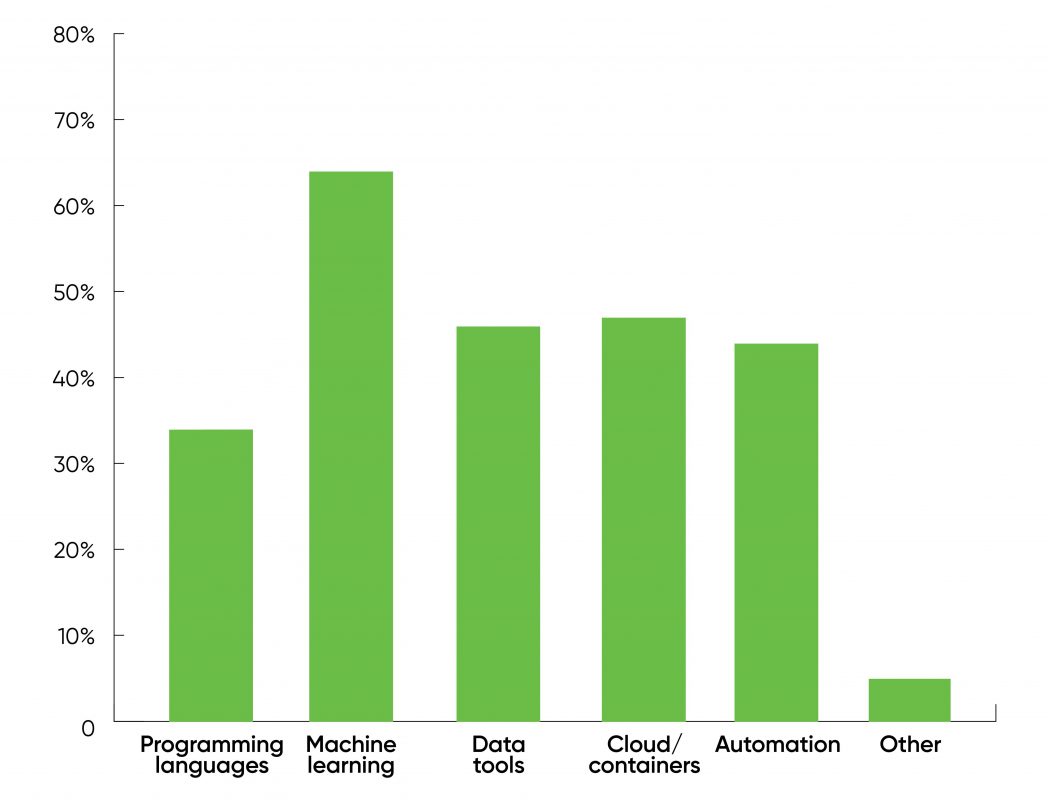
But perhaps we should leave the last word to our respondents. The final question in our survey asked what areas of technology would have the biggest effect on salary and promotions in the coming year. It wasn’t a surprise that most of the respondents said machine learning (63%)—these days, ML is the hottest topic in the data world. It was more of a surprise that “programming languages” was noted by just 34% of respondents. (Only “Other” received fewer responses—see Figure 13 for full details.) Our respondents clearly aren’t impressed by programming languages, even though the data suggests that employers are willing to pay a premium for Rust, Go, and Scala.
There’s another signal worth paying attention to if we look beyond the extremes. Data tools, cloud and containers, and automation were nearly tied (46, 47, and 44%). The cloud and containers category includes tools like Docker and Kubernetes, cloud providers like AWS and Microsoft Azure, and disciplines like MLOps. The tools category includes tools for building and maintaining data pipelines, like Kafka. “Automation” can mean a lot of things but in this context probably means automated training and deployment.
We’ve argued for some time that operations—successfully deploying and managing applications in production—is the biggest issue facing ML practitioners in the coming years. If you want to stay on top of what’s happening in data, and if you want to maximize your job security, hireability, and salary, don’t just learn how to build AI models; learn how to deploy applications that live in the cloud.
In the classic movie The Graduate, one character famously says, “There’s a great future in plastics. Think about it.” In 2021, and without being anywhere near as repulsive, we’d say, “There’s a great future in the cloud. Think about it.”