APPENDIX
B Bounds on the Q-Function
Following Chapter 3, we define the Q-function as
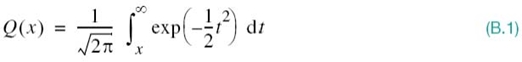
which represents the area under the tail of the standard Gaussian distribution. In this appendix, we derive some useful bounds on the Q-function for large positive values of x.
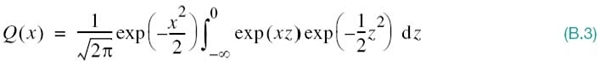
To this end, we change the variable of integration in (B.1) by setting
![]()
and then recast (B.1) in the form
For any real z, the value of exp (−1/2z2) lies between the successive partial sums of the power series:
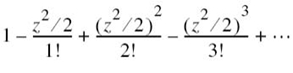
Therefore, for x > 0 we find that, on using (n + 1) terms of this series, the Q-function lies between the values taken by the integral
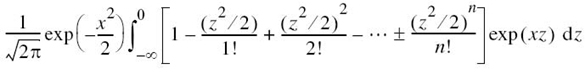
for even n and odd n. We now make another change in the integration variable by setting
![]()
and also use the definite integral
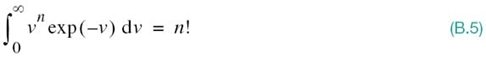
Doing so, we obtain the following asymptotic expansion for the ...
Get Digital Communication Systems now with the O’Reilly learning platform.
O’Reilly members experience books, live events, courses curated by job role, and more from O’Reilly and nearly 200 top publishers.

