January 2019
Intermediate to advanced
316 pages
8h 16m
English
To visualize the losses for the training, start the TensorBoard server as follows:
tensorboard --logdir=logs
Now, open localhost:6006 in your browser. The SCALARS section of TensorBoard contains plots for both losses as shown here:
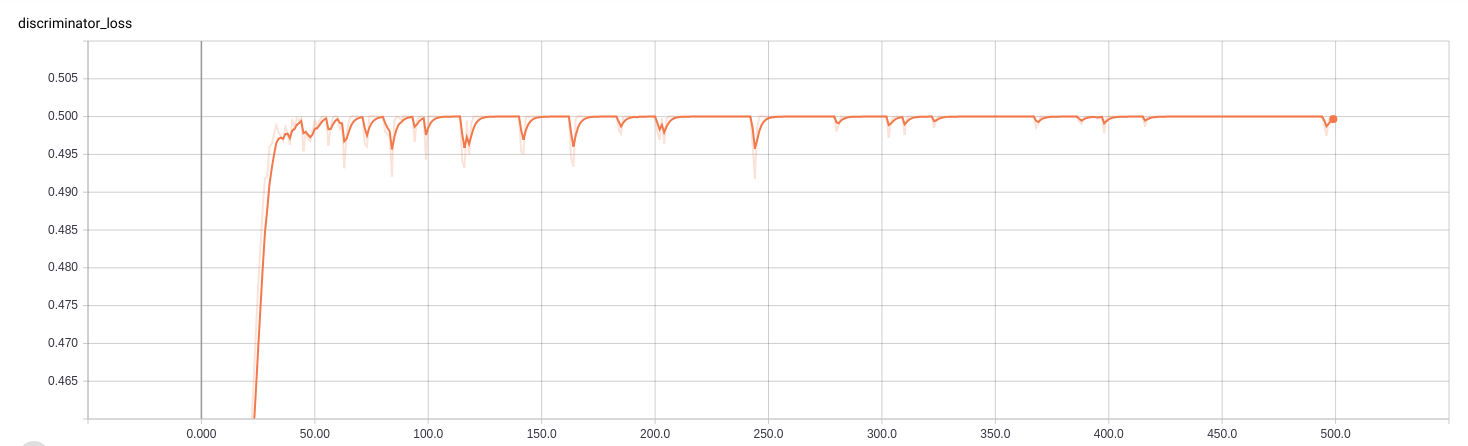
The loss plot for the discriminator network for Stage-I is shown as follows:
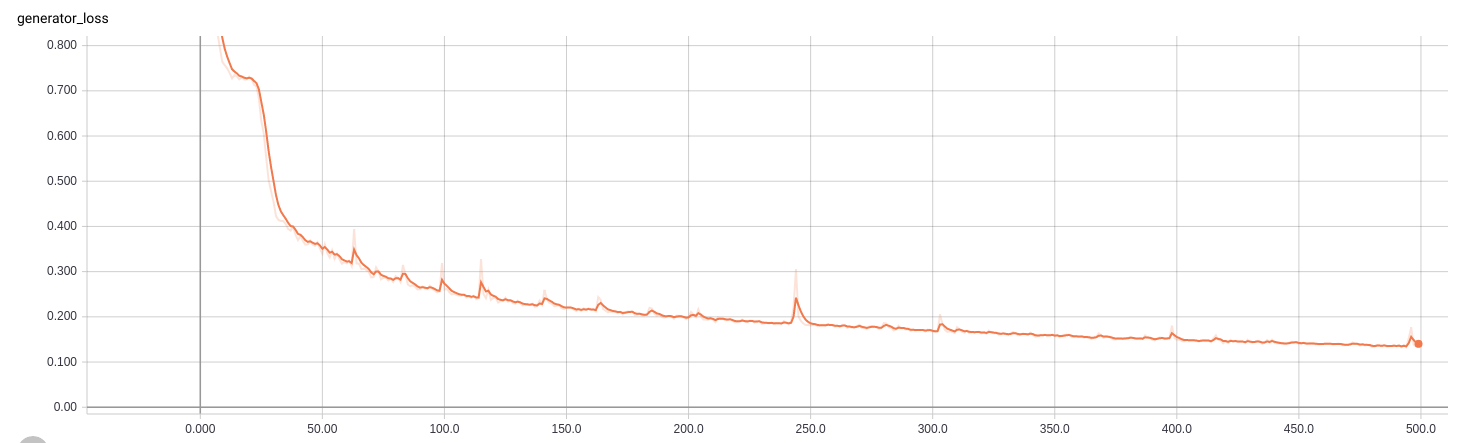
The loss plot for the generator network for Stage-I is shown as follows:
Loss plots for the generator network and the discriminator network for Stage-II can be similarly obtained from Tensorboard.
These plots will help ...
Read now
Unlock full access


