Chapter 7. Putting It All Together
Let’s put everything we’ve learned to use and build something! We’ve put together a demo that leverages much of what you’ve learned and made a Service to visualize earthquake activity throughout the world by consuming the USGS Earthquake data feed. You can find the code that we’ll be walking through in the gswk/earthquake-demo GitHub repository.
The Architecture
Before we dive into the code, let’s take a look at the architecture of our application, shown in Figure 7-1. We’re building three important things here: An Event Source, a Service, and a frontend.
Each of these components inside of Knative in the diagram represents something we’ll build leveraging something we’ve learned so far, including a Service that will use the Kaniko Build Template and a custom Event Source that will poll for our data:
- USGS Event Source
-
We’ll build a custom ContainerSource Event Source that will poll the data provided by the USGS at a given interval. Packaged up as a prebuilt container image.
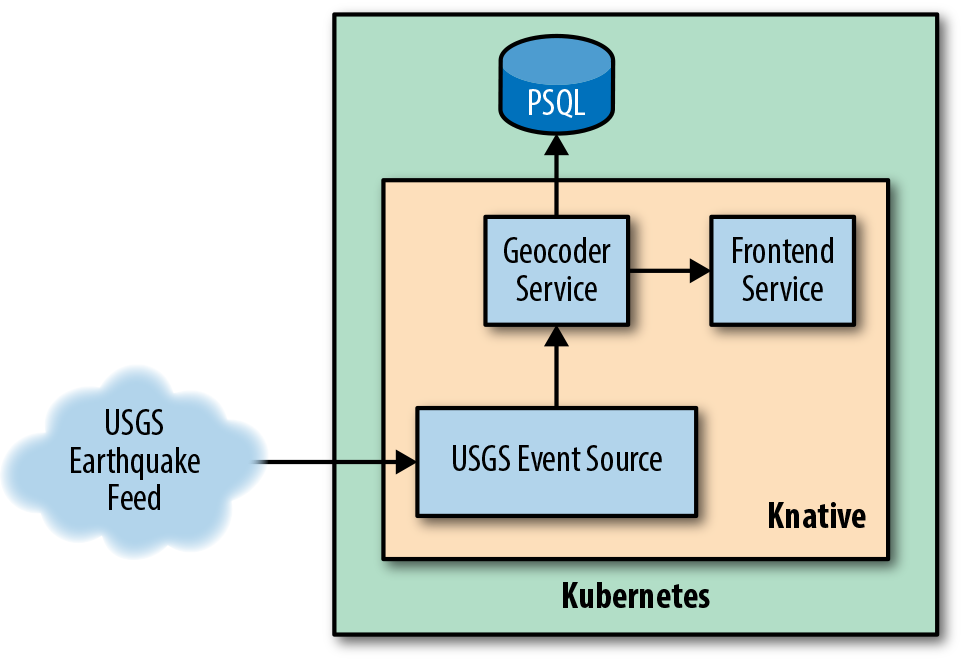
Figure 7-1. Architecture of our application. Events come in from the USGS Earthquake feed into our Event Source, which triggers our Geocoder Service to persist events. Our frontend will also use our Geocoder Service to query for recent events.
- Geocoder Service
-
This will provide an endpoint for the Event Source to POST events to, and will use the provided coordinates ...
Get Getting Started with Knative now with the O’Reilly learning platform.
O’Reilly members experience books, live events, courses curated by job role, and more from O’Reilly and nearly 200 top publishers.

