August 2017
Beginner to intermediate
472 pages
10h 17m
English
path elements are SVG’s answer to drawing irregular forms. Anything that’s not a rect, circle, or another simple shape can be drawn as a path. The catch is that the syntax for defining path values is not particularly human-friendly. For example, here is a line that we’ll generate from data in this chapter. Note the path syntax, as specified in the element’s d attribute and shown in Figure 11-1.
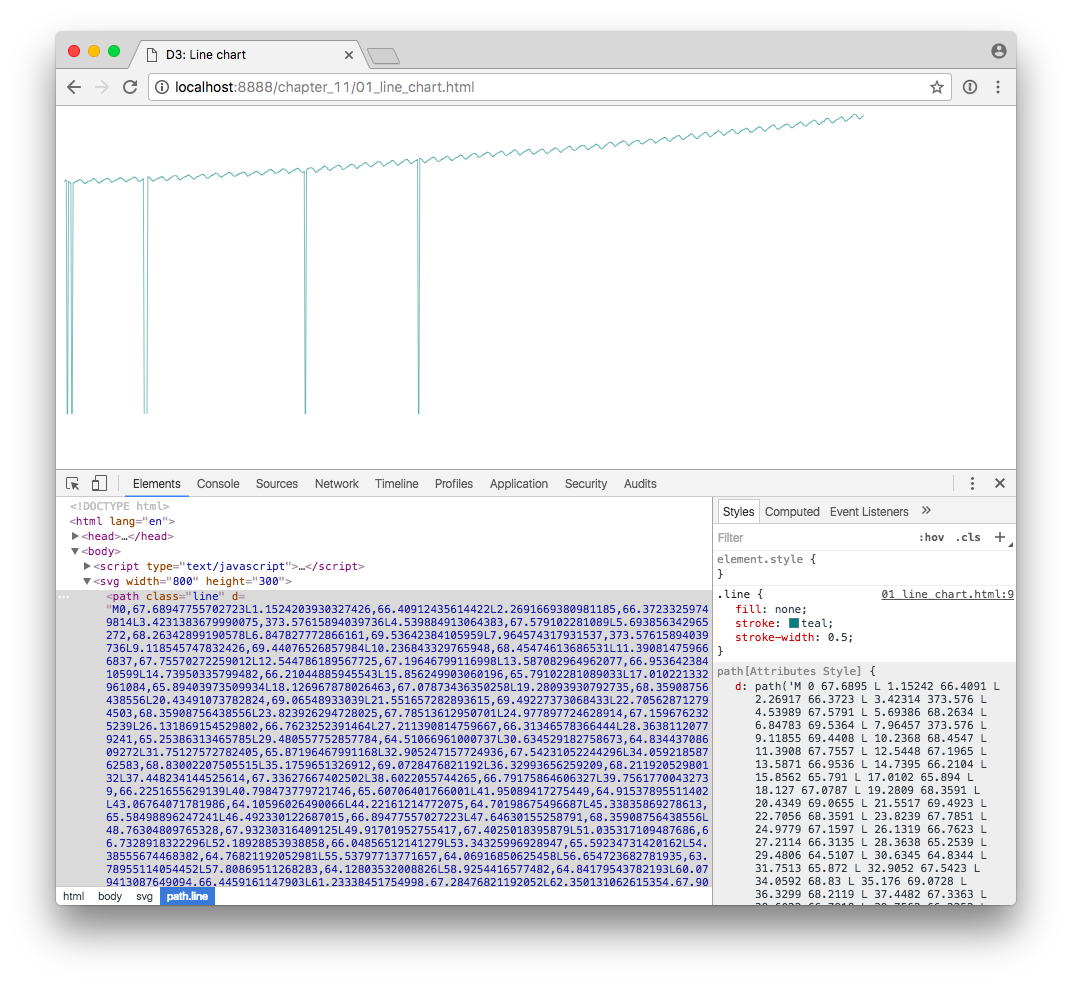
If you can read that, then you don’t need this book.
Fortunately, D3 has lots of built-in functions that generate paths for you. You’ve already met the axis functions, which express scales as path, line, and text elements. In later chapters, you’ll learn about d3.arc() and d3.geoPath(), both of which also generate paths for different purposes. In this chapter, we’ll cover two other common uses of paths: drawing line and area charts.
Let’s start with a simple line chart. Actually generating the line is quite simple, but we need some data in place first. For this chapter, I’m going to use a real-world dataset.
Line charts are great for time series, so I’ve decided to chart carbon dioxide measurements over time. I’ve downloaded the “Mauna Loa CO2 monthly mean data”, as provided by the National Oceanic & Atmospheric Administration’s Earth System Research Laboratory. (See the README.md in this chapter’s ...
Read now
Unlock full access


