August 2017
Beginner to intermediate
472 pages
10h 17m
English
You’re nearly a D3 pro! You have already worked your way through a full 118 code examples, each one illustrating a specific concept or technique. I thought we’d wrap up our time together with a walk-through of a single, complete D3 project from start to finish, integrating many of the technical concepts covered earlier, and sharing a few new tips along the way.
Our subject will be electric cars because, let’s be honest: I kind of want one. (Maybe with a built-in D3 dashboard?)
The sequence we’ll follow to achieve this is as follows:
Prepare the data
Load and parse the data
Render the initial view
Add interactivity
Refine styling
Provide context
For each of these, I’ll highlight the most important steps.
Remember Figure 16-1, the stacked area chart from Chapter 13?
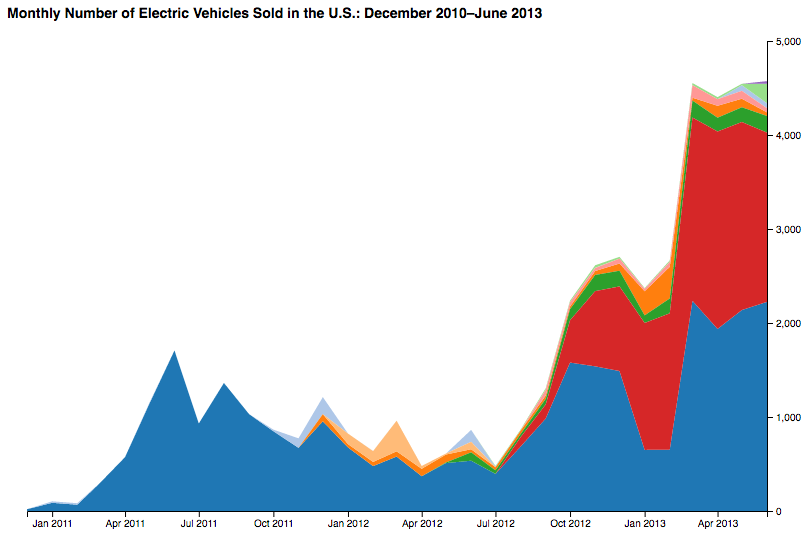
Well, I found this data really compelling, but it wasn’t exactly current, ending at June 2013. It’s 2017, people! Just in the past few months, we’ve seen many new electric models, including the Model X from Tesla, the Chevrolet Bolt (the first “affordable” electric car with a range of over 200 miles—i.e., not a Tesla), and the first-ever plug-in hybrid minivan (the Chrysler Pacifica). With the growing array of electric, plug-in hybrid, and other alternative-fuel vehicles, I wanted to see how many more options we have now, ...
Read now
Unlock full access


