Skip to Content
Learning Google BigQuery
book

Learning Google BigQuery

by Thirukkumaran Haridass, Eric Brown
December 2017
Beginner to intermediate
264 pages
5h 38m
English
Packt Publishing
Content preview from Learning Google BigQuery

Making a scatterplot in Data Studio

The following steps show how to make a scatterplot in Data Studio with the data from BigQuery:

  1. Update the original query by adding the transaction metric. In the edit screen of your report, click on the bar chart to bring up the chart options on the right-hand-side navigation. Click on the pencil icon next to the data source titled BigQuery to edit the data source.
  2. Click on the left-hand-side arrow icon titled Edit Connection:
  1. In the dialog titled Enter Custom Query, add this query:
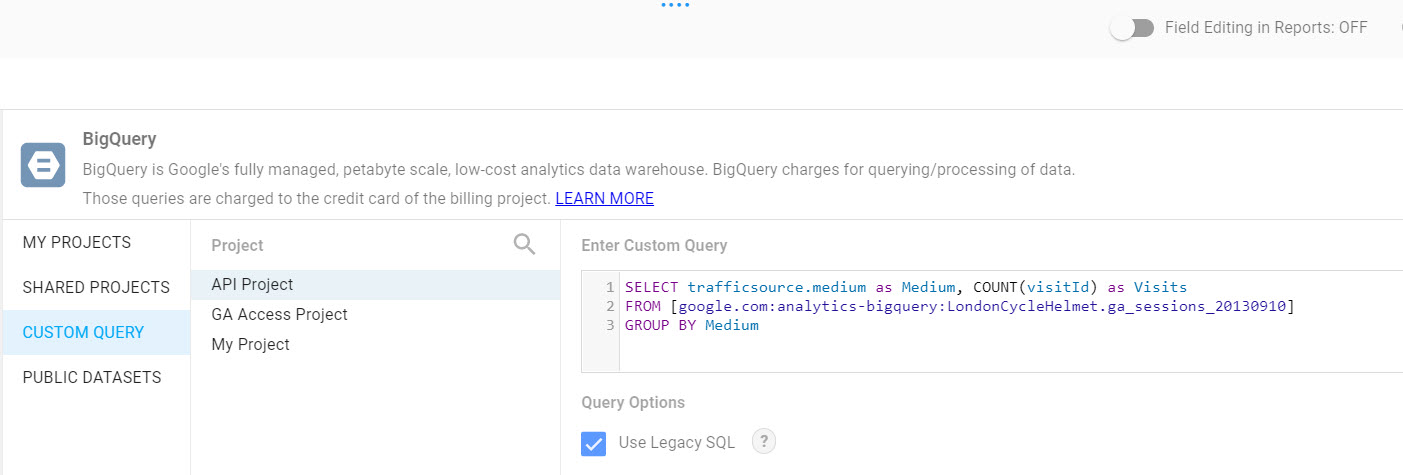
SELECT trafficsource.medium as Medium, COUNT(visitId) as Visits,SUM(totals.transactions) AS TransactionsFROM `google.com:analytics-bigquery.LondonCycleHelmet.ga_sessions_20130910` ...
Become an O’Reilly member and get unlimited access to this title plus top books and audiobooks from O’Reilly and nearly 200 top publishers, thousands of courses curated by job role, 150+ live events each month,
and much more.
Start your free trial

You might also like

Google BigQuery: The Definitive Guide

Google BigQuery: The Definitive Guide

Valliappa Lakshmanan, Jordan Tigani
Google BigQuery Analytics

Google BigQuery Analytics

Siddartha Naidu, Jordan Tigani

Publisher Resources

ISBN: 9781787288591Supplemental Content