Plotting the column, pie, donut, and scatter series in 3D charts
In this section, we will plot a gallery of column, pie, donut, and scatter series which are currently supported for 3D presentation. We will also examine the 3D options specific to each series. Some of the examples used here are taken from previous chapters.
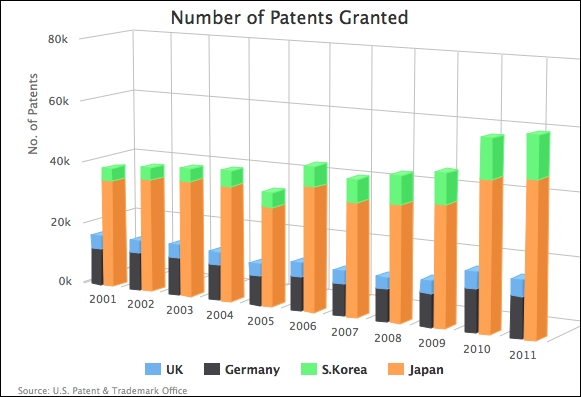
3D columns in stacked and multiple series
Let's start with a multi-series stacked column chart embedded with the options3d setting:
                options3d: {
                    alpha: 10,
                    beta: 30,
                    enabled: true
                }
Here is what a multi-series grouped and stacked 3D columns chart looks like:
Column depth and Z-padding
Notice from the preceding chart, the sides of the ...
Get Learning Highcharts 4 now with the O’Reilly learning platform.
O’Reilly members experience books, live events, courses curated by job role, and more from O’Reilly and nearly 200 top publishers.

