Plotting time-series prices
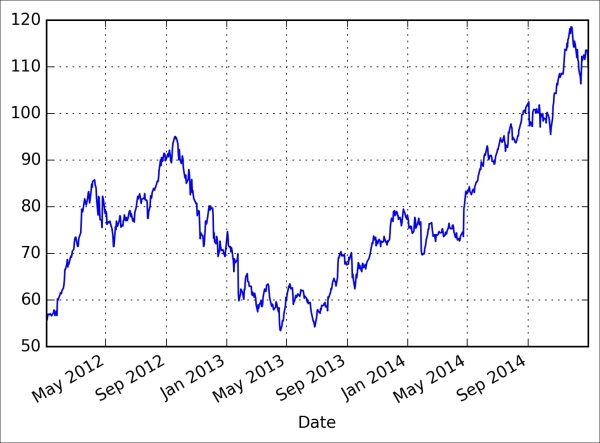
We will perform a graphical comparison of the closing values for AAPL and MSFT. Using the closing prices DataFrame, it is simple to plot the values for a specific stock using the .plot() method of Series. The following plots the adjusted closing price for AAPL:
In [9]:
   # plot the closing prices of AAPL
   close_px['AAPL'].plot();

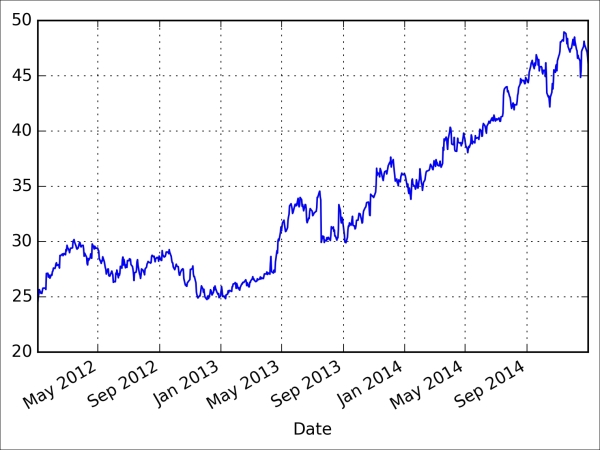
The following code plots the adjusted closing price for MSFT:
In [10]:
   # plot the closing prices of MSFT
   close_px['MSFT'].plot();

Both sets of closing values can easily be displayed on a single ...
Get Learning pandas now with the O’Reilly learning platform.
O’Reilly members experience books, live events, courses curated by job role, and more from O’Reilly and nearly 200 top publishers.

