Chapter 6. Regularization: Text Regression
Nonlinear Relationships Between Columns: Beyond Straight Lines
While we told you the truth in Chapter 5 when we said that linear regression assumes that the relationship between two variables is a straight line, it turns out you can also use linear regression to capture relationships that aren’t well-described by a straight line. To show you what we mean, imagine that you have the data shown in panel A of Figure 6-1.
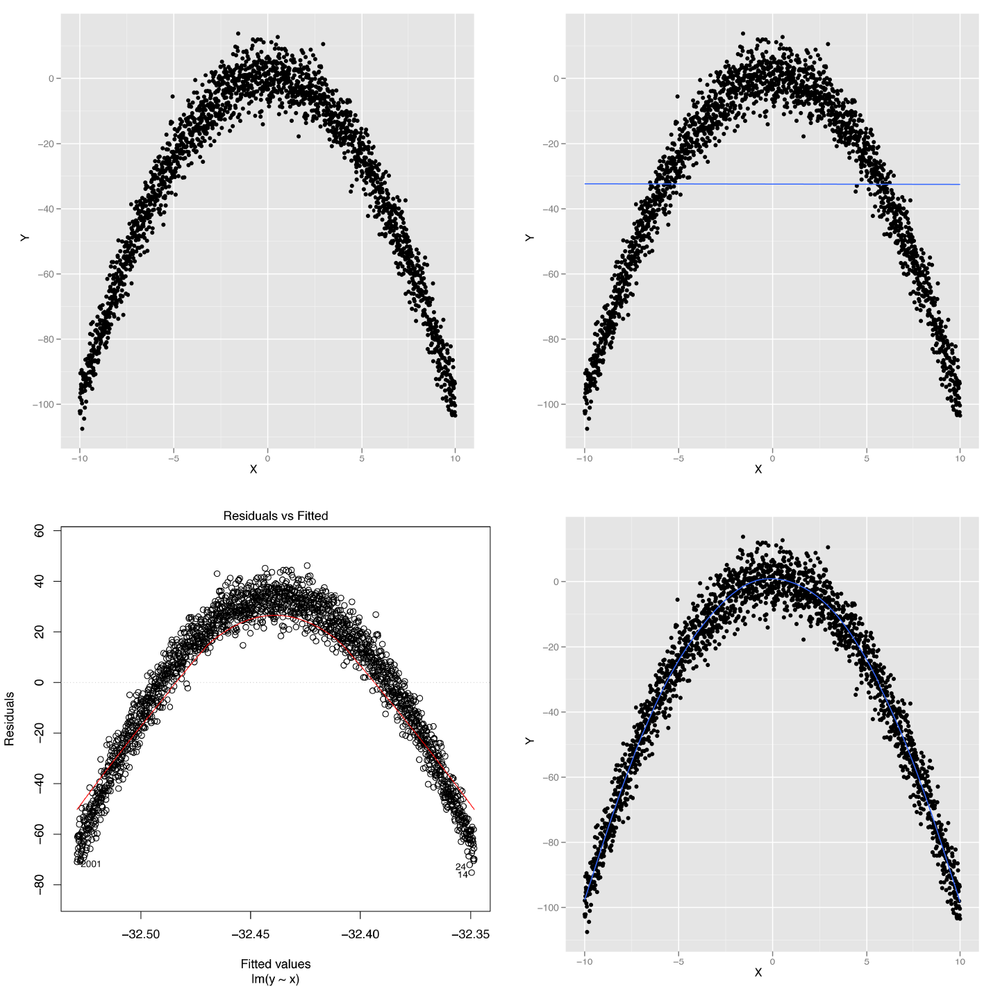
Figure 6-1. Modeling nonlinear data: (A) visualizing nonlinear relationships; (B) nonlinear relationships and linear regression; (C) structured residuals; (D) results from a generalized additive model
It’s obvious from looking at this scatterplot that the relationship between X and Y isn’t well-described by a straight line. Indeed, plotting the regression line shows us exactly what will go wrong if we try to use a line to capture the pattern in this data; panel B of Figure 6-1 shows the result.
We can see that we make systematic errors in our predictions if we
use a straight line: at small and large values of x, we
overpredict y, and we underpredict y for
medium values of x. This is easiest to see in a residuals
plot, as shown in panel C of Figure 6-1.
In this plot, you can see all of the structure of the original data set,
as none of the structure is captured by the default linear regression
model.
Using ggplot2’s geom_smooth function ...
Get Machine Learning for Hackers now with the O’Reilly learning platform.
O’Reilly members experience books, live events, courses curated by job role, and more from O’Reilly and nearly 200 top publishers.

