October 2017
Beginner to intermediate
270 pages
7h
English
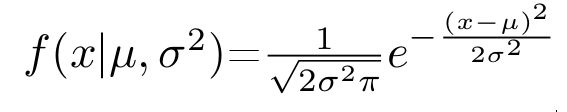
This very common continuous random function, also called a Gaussian function, can be defined with the simple metrics of the mean and the variance, although in a somewhat complex form.
This is the canonical form of the function:
Take a look at the following code snippet:
import matplotlib.pyplot as plt #Import the plot library import numpy as np mu=0. sigma=2. distro = np.random.normal(mu, sigma, 10000) plt.hist(distro, 100, normed=True) plt.show()
The following graph shows the generated distribution's histogram:
Read now
Unlock full access


