October 2017
Beginner to intermediate
270 pages
7h
English
To introduce gradient descent, we will first take a look at our objective—the fitting of a line function to a set of provided data. And what do we have as elements?
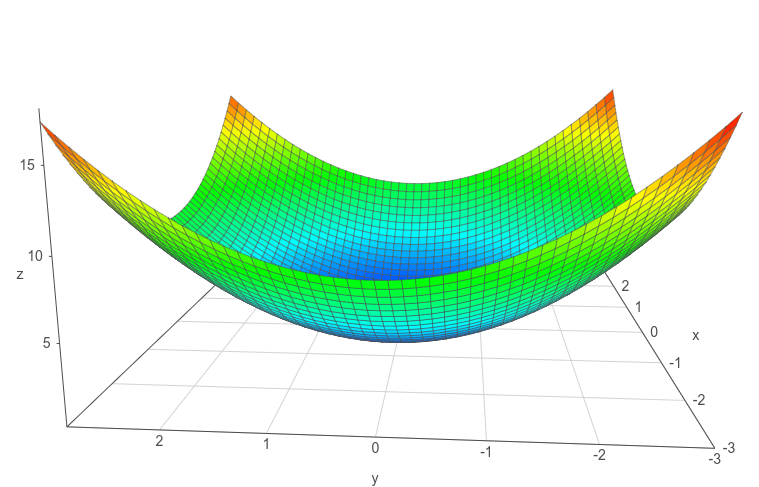
Another element that we could get is a representation of all the possible errors for any of the combinations of the parameters. That would be cool, right? But look at what such a function looks like just for a problem with a simple line as the solution. This curve represents z= x2 + y2, which follows the form of the least squares error function:
Read now
Unlock full access


