October 2017
Beginner to intermediate
270 pages
7h
English
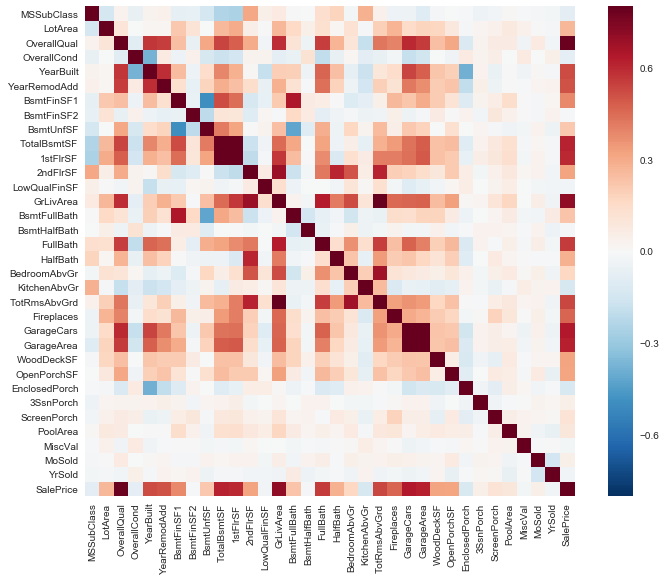
The correlation plot allows us to summarize the variable dependency in a much more succinct way, because it shows the direct correlation between variable pairs, using a color pallet. The diagonal values are of course 1, because all variables have a maximum correlation with themselves:
Read now
Unlock full access


