CHAPTER 2
CHAPTER 2. Fundamentals of Mapping Experiences
“The purpose of visualization is insight, not pictures.”
IN THIS CHAPTER
- Framing the mapping effort
- Touchpoints
- Moments of truth
- Value creation
- Case study: Consumer intervention mapping—designing strategies for the circular economy
The cause of the great cholera outbreak in London in 1854 was initially unclear. Prior to Louis Pasteur’s germ theory, many thought the disease was in the air. John Snow, a London physician, had a different explanation. He believed cholera was in the water. After microscopic examinations were inconclusive, Snow instead analyzed the spread of cholera to prove his hunch.
To do this, Snow mapped cholera cases in Soho, London (Figure 2-1). The resulting patterns demonstrated causality: proximity to a certain water pump correlated to cholera cases with high predictability. The decline of cholera is credited to Snow’s recommendation to shut down that pump.
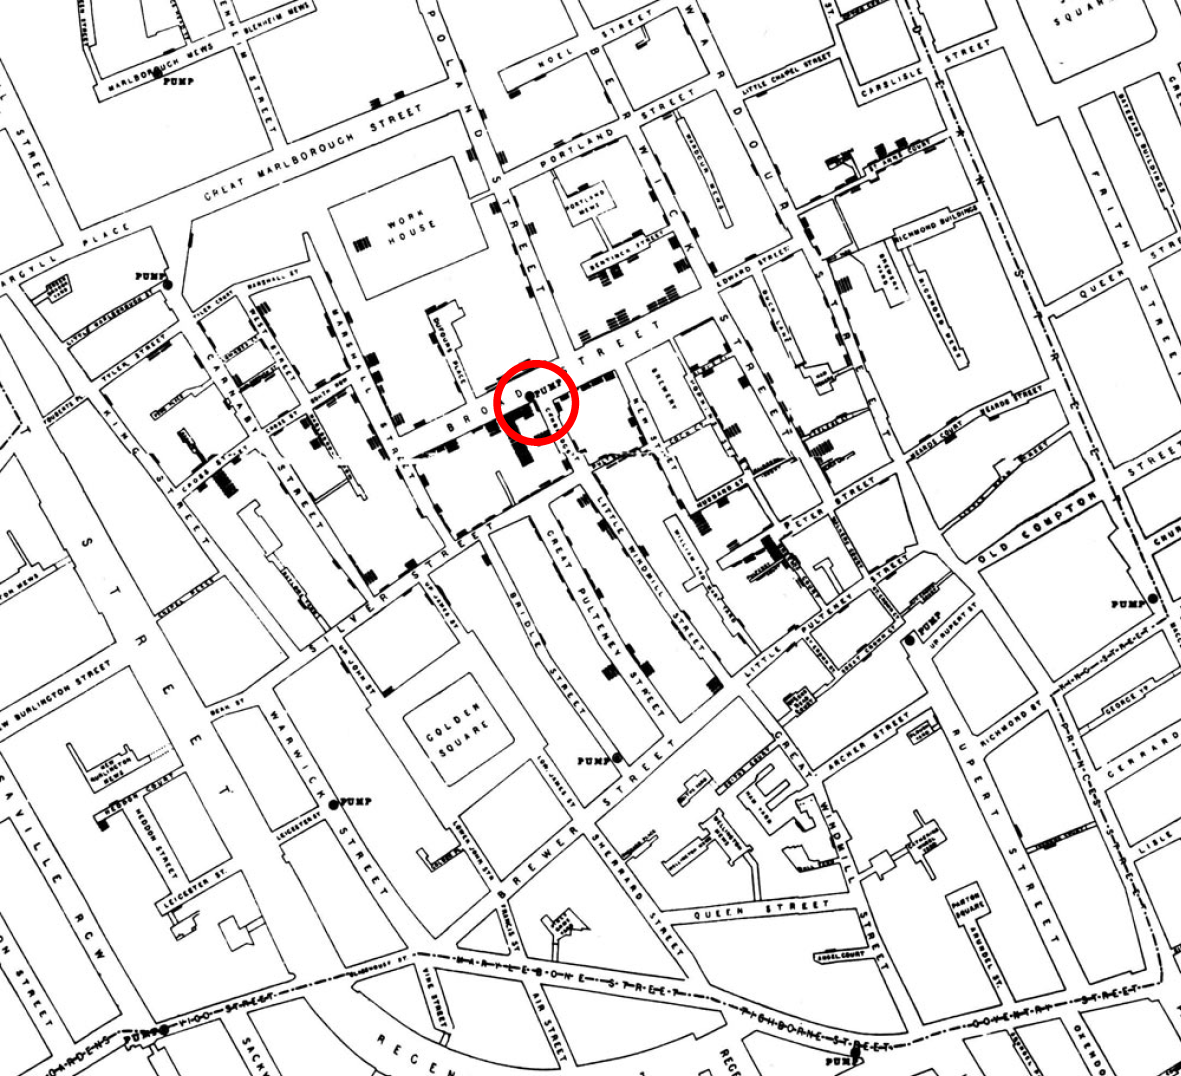
FIGURE 2-1. John Snow’s map of London during the great cholera outbreak of 1854. The red circle highlights the water pump that was the source of the disease.
Snow’s map contained multiple layers of information—streets, houses with cholera cases, and water pumps—just enough to reveal previously undetected evidence (in this case, the cause of a disease). The approach was simple but effective, ...
Get Mapping Experiences, 2nd Edition now with the O’Reilly learning platform.
O’Reilly members experience books, live events, courses curated by job role, and more from O’Reilly and nearly 200 top publishers.

