Chapter 4. Operations and Security
If you don’t secure Kubernetes and its associated networking components, your business might get cryptojacked or worse. Likewise, just getting the applications onto the platform in the first place is only the first step in a long production lifetime—good monitoring is critical to make sure they keep running fast and smoothly. In this section, we’ll cover operations and security challenges and possible solutions you should investigate while adopting Kubernetes.
Authentication and Authorization
Operations in Kubernetes entail a lot of challenges around client authentication and authorization. After all, how do you, the operator of a Kubernetes cluster, know and trust that the Kubernetes client attempting to connect and perform API calls is who they say they are and should be trusted? Authentication is the process of ensuring that the client making the request has a particular identity. Authorization is the process of making sure that, once authenticated, the client has permission to perform the action they’re attempting.
These concepts are important for automation on top of Kubernetes as well as manual operator access because permissions should always be scoped down as much as possible. After all, cluster admin access on Kubernetes is root-level access on the whole cluster—otherwise, Kubernetes wouldn’t be able to perform all the operations it needs to deliver its end results.
Kubernetes provides some constructs for managing these issues, but has limitations too. For instance, Kubernetes does not have any notion of a user account. Everything must be managed using certificates, role-based access control (RBAC), and service accounts, which are a way of defining a particular set of API permissions that a Pod running on the cluster is authorized for.
If an external client makes a request to the Kubernetes API, the API will check the certificates presented by that client to find out which user is making the request, and determine if the user has the correct permissions based on the cluster’s RBAC configuration. While Kubernetes assumes that an external system manages the user accounts, it infers which user is making the request from the presented certificate, and checks whether the user has the right permission to perform the operation based on the RBAC config. For organizations that need to integrate with a form of external identity source such as Active Directory, Kubernetes also supports OpenID Connect (OIDC), a flavor of OAuth 2.0 that allows integration with such identity platforms. Just as we have discussed previously, integrating OIDC will require additional effort if you decide to roll your own cluster instead of using a pre-configured offering.
For workloads that are running within the cluster and need to perform operations using the Kubernetes API, such as updating the container image used by a pod, service accounts are used to grant the correct permissions. In fact, all Pods have a default service account, and it’s important to check that the default one on your cluster is scoped down. While you generally want to restrict permissions, you might have other use cases where it’s OK for Pods to have higher privileges. For instance, you might have a deployment bot that rolls out new versions of an app every hour, and it will need its service account configured correctly to enable this.
As with many aspects of Kubernetes, the documentation for both authentication and authorization are important to review in detail as you move forward. Those will help guide you towards ensuring that access to critical systems such as the Kubernetes API are safe.
Monitoring and Tracing
Monitoring and tracing play a key role in delivering on the promise of an optimal vertex between speed and safety. Taken together, monitoring and tracing broadly define what is known as observability: the ability to ask questions of your systems and understand what is happening within them. The underlying source of a given issue might be a “good” (lots of interest in your public website) or “bad” (accidentally triggering expensive SQL commands that take down your system) root cause, but either way, you need to be able to understand what is occurring so your operators can fix it. Monitoring and tracing are necessities for the “measure everything” approach many DevOps teams take—not just for reacting to problems, but for improving the general health of your service and influencing ongoing development.
Distributed tracing is a technique that can help you achieve this goal. Tracing allows you to visualize the lifecycle of one request as it flows through different components of the system. Tracing is especially important if we’re rolling out microservices, a popular architectural pattern separating apps into small decoupled services.
How do you want to approach monitoring and tracing in Kubernetes? Many teams start simply with infrastructure metrics monitoring. Seeing a big spike in metrics such as CPU usage, memory, or number of jobs waiting in a queue can be a big hint that something is way off in your systems. This might be handled a little differently than you’re accustomed to, though, as you’ll need to shift your focus away from the node level and towards the Pod and application level. This type of metrics deployment is readily achievable in many ways including by using open source systems such as Prometheus, which is a scrape-based system that gathers information from Pods every 15 seconds.
Prometheus is far from the be-all and end-all of monitoring, but it’s a lovely option to have available because previously the availability of robust metrics time series databases was slim. Prometheus has heaps of solutions available for everything under the sun from use cases that need to push data instead of following the pull-based model, alerting, and creating gorgeous dashboards with Grafana.
Once you have monitoring set up, integrating a tracing system is a logical next step. Jaeger, which is depicted in Figure 4-1, is a CNCF project that enables you to send traces from libraries embedded within your applications based upon the idea of span blocks describing what’s happening over time and how long it’s taking. Based on this data, you can search for what’s slow or having errors in your programs, and follow along with what happened at each step in a call that spanned multiple services.
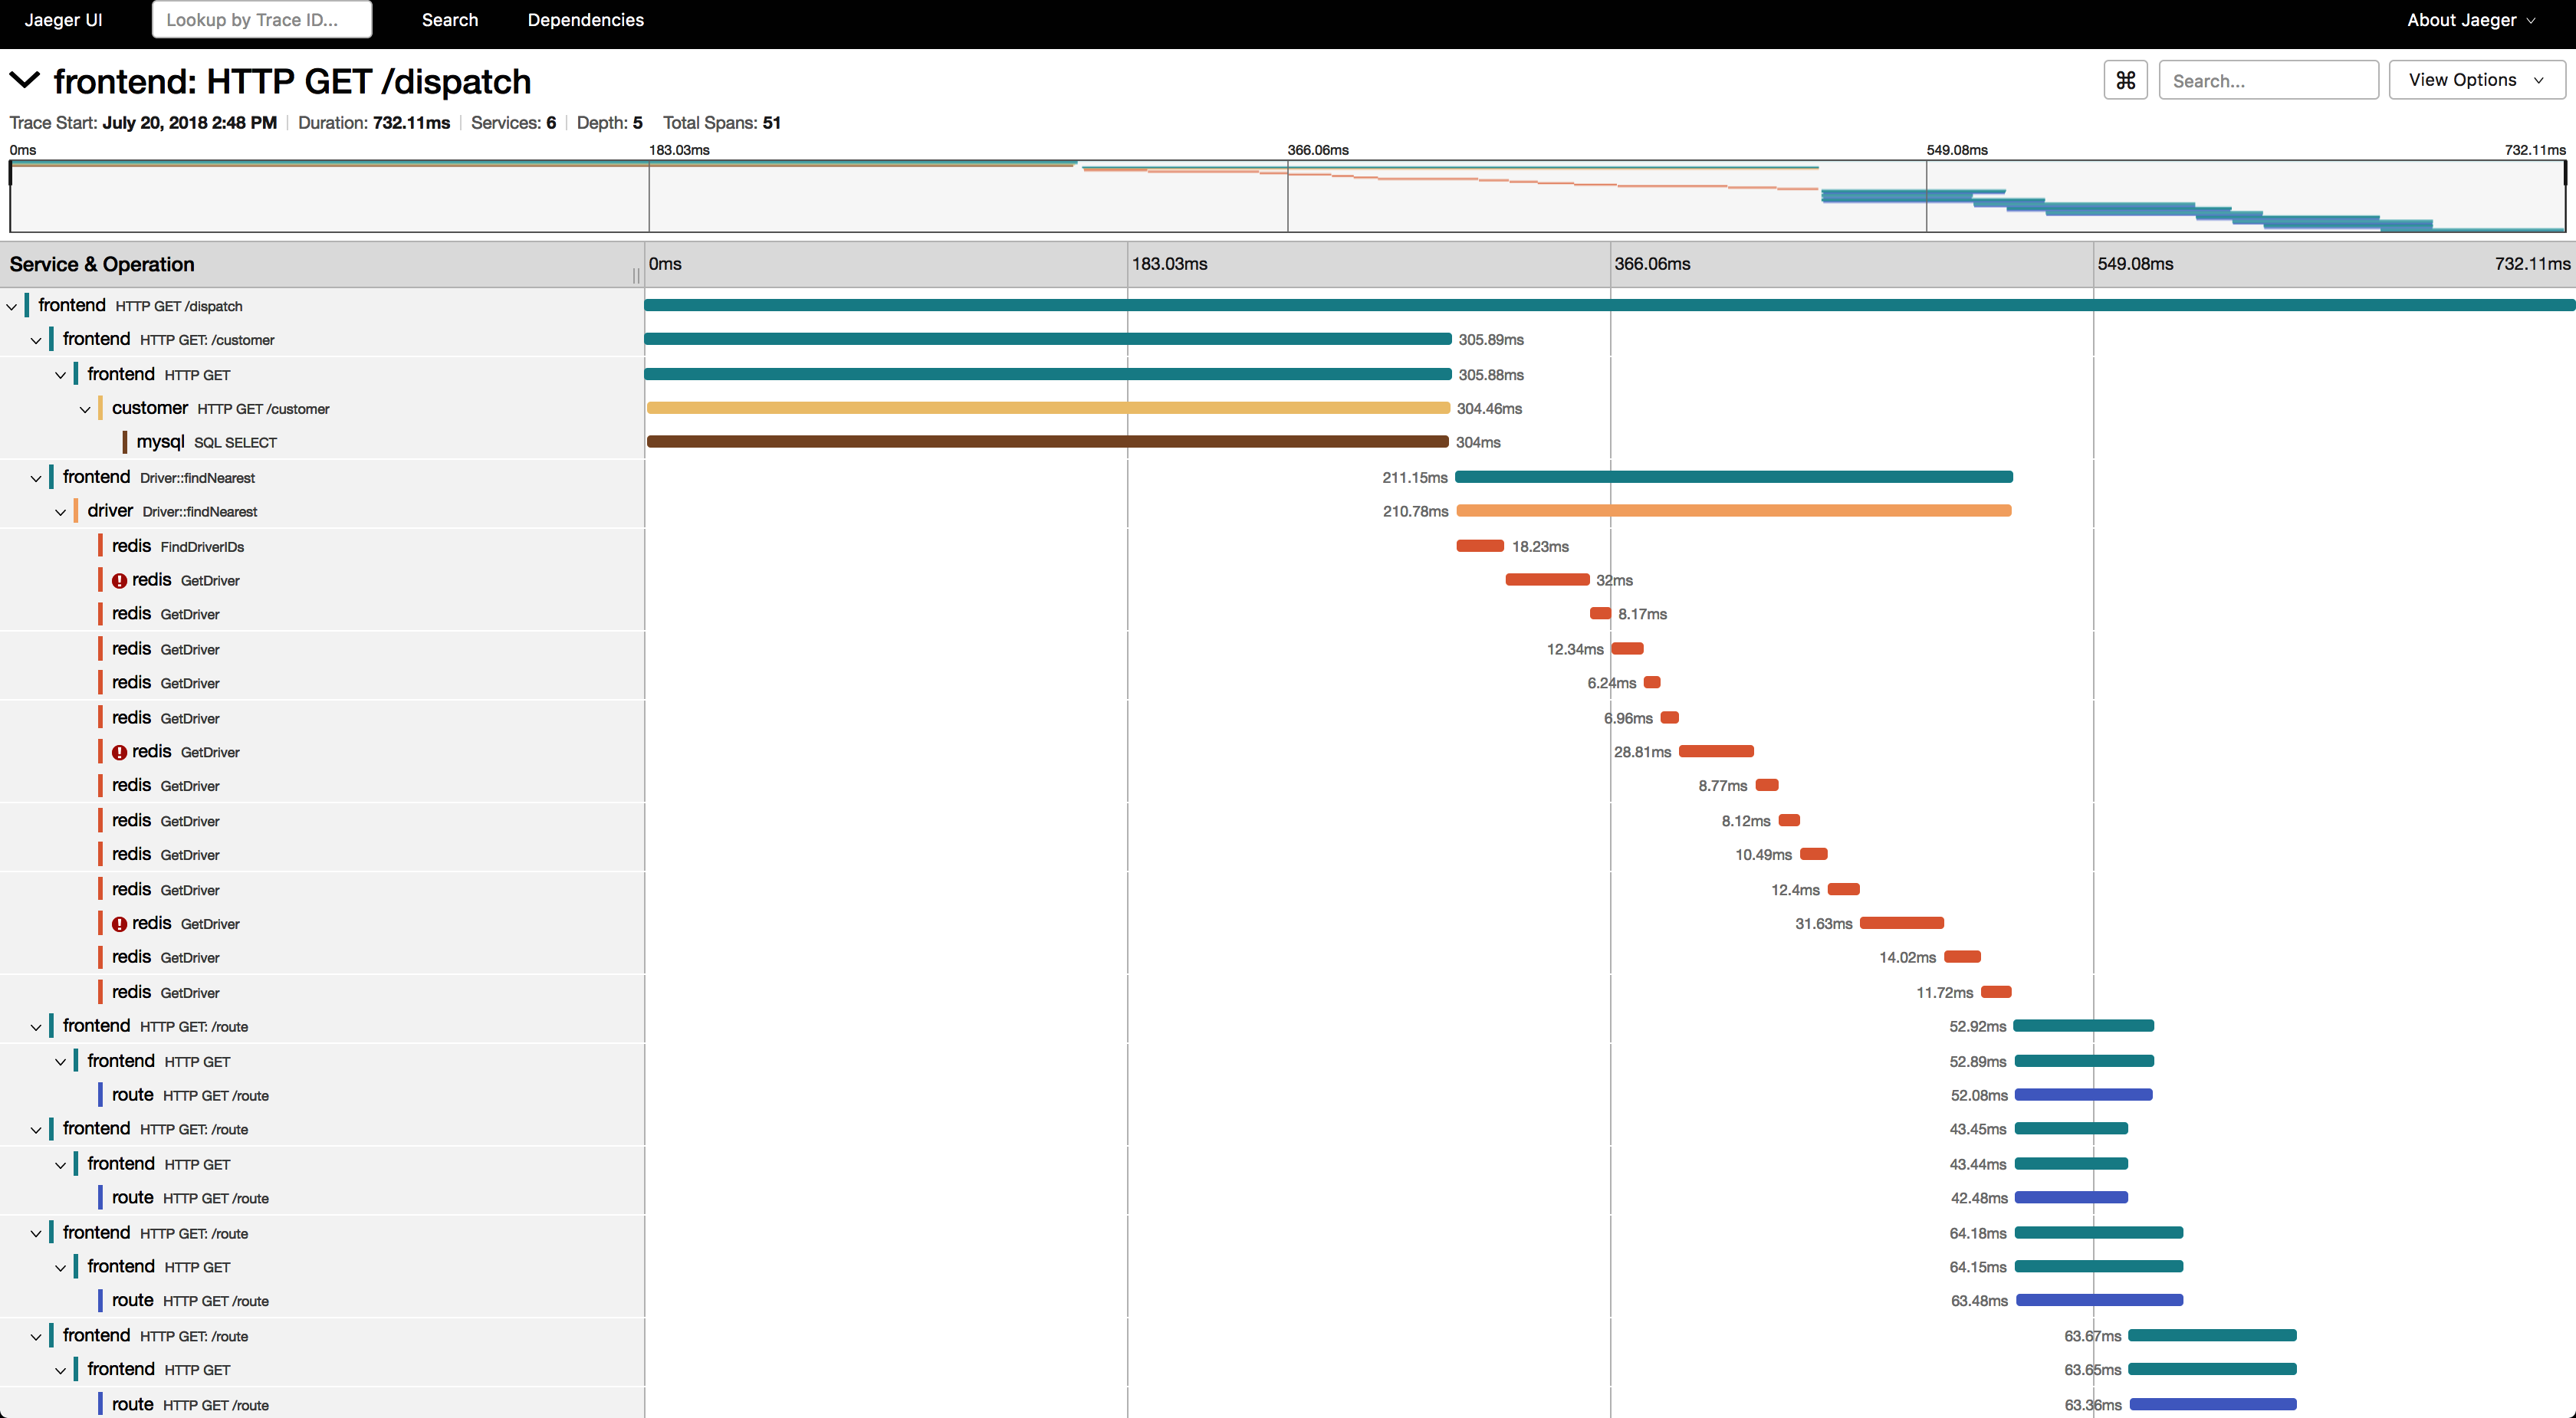
Figure 4-1. The waterfall view in a tracing system shows you what happened in your apps over time. Each span represents a timed chunk of work.
Jaeger offers a great all-in-one mode to get started, so it’s an easy way to experiment and get your legs under you as you begin to explore the landscape of tools and standards such as OpenTelemetry. When it comes time to use tracing in production, you could scale up Jaeger by using a data store such as Cassandra or you could send your tracing data to a vendor such as Honeycomb. There are a lot of options available—give them a spin and see if your team will benefit from adopting tracing.
Log Aggregation
When managing production operations, dealing with logs is inevitable. Not only are they the most common way for your company’s applications to output data describing what’s happening within your apps, they are often your only way to figure out what’s happening inside the black boxes your system relies on (such as the daemons of Kubernetes itself). Traditionally, processes might log to inconsistent places within your infrastructure, as depicted in Figure 4-2. Logs might end up in a system journal, a file in /var/log, or some other destination altogether.
Logs in Kubernetes are a whole different ball game from what you might be accustomed to. We discussed porting your apps to log the Kubernetes way in Chapter 2. So what happens once that’s set up?
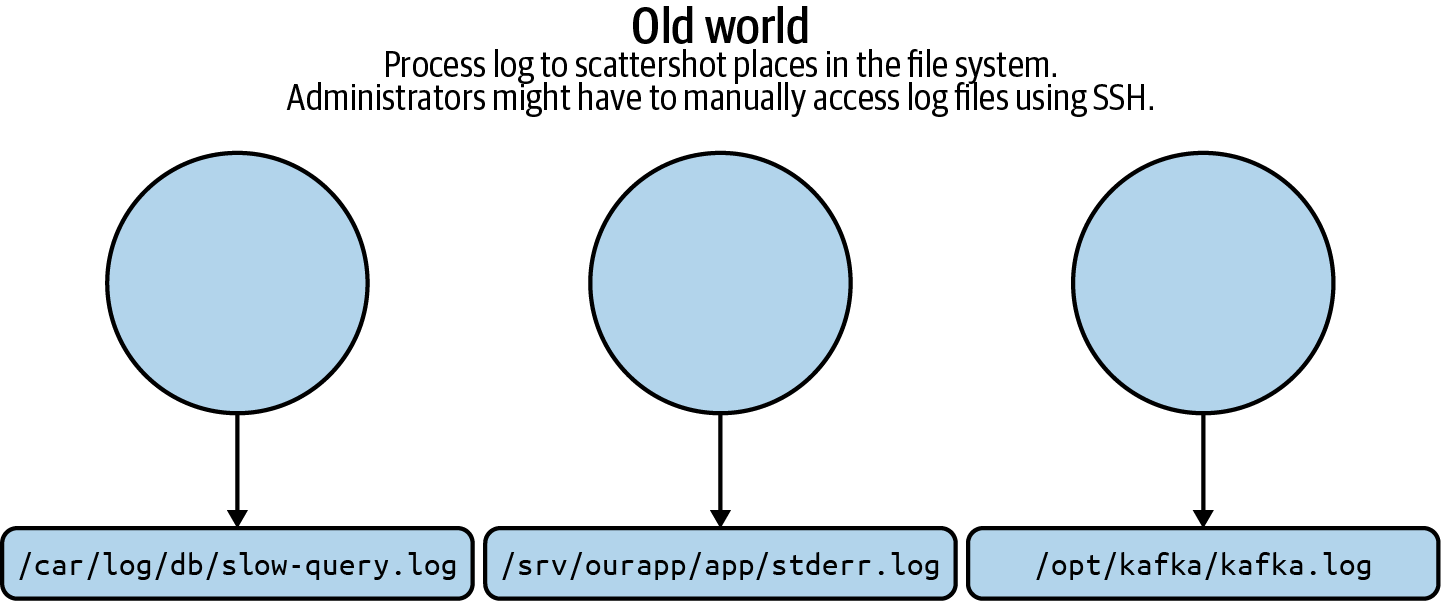
Figure 4-2. Managing logs is a perennial infrastructure pain.
Once the containers are configured properly, you need to extract those logs and make them useful. Kubernetes has some command line options available for viewing logs, but very little in the way of getting them all at a glance. Looking up logs from various parts of the system can be tedious and confusing. Given the ephemeral nature of containers, the Pod might be rescheduled and the logs gone by the time an operator gets a chance to look over what happened. Storing your logs in a centralized system is, therefore, important for operational, regulatory, and compliance reasons. Centralized logging is a way of importing all the logs from your Pods into one storage system for access and querying.
So what does tackling centralized logging look like? Figure 4-3 shows a diagram illustrating the basic principles.
In centralized logging, all logs (for both applications and the system level) are forwarded to a centralized storage system (such as Elasticsearch) that indexes them and makes them available for easy searching. Often, there will be intermediate or post hoc processing applied as well to add structure and make diving through the logs to find the relevant information easier for end users.
Intermediate layers like Cribl and fluentd can also be used to forward or “tee” the logs to various locations. For instance, one might want to archive all logs to system storage as they come in as well as forwarding them to an indexing system for free-form search.
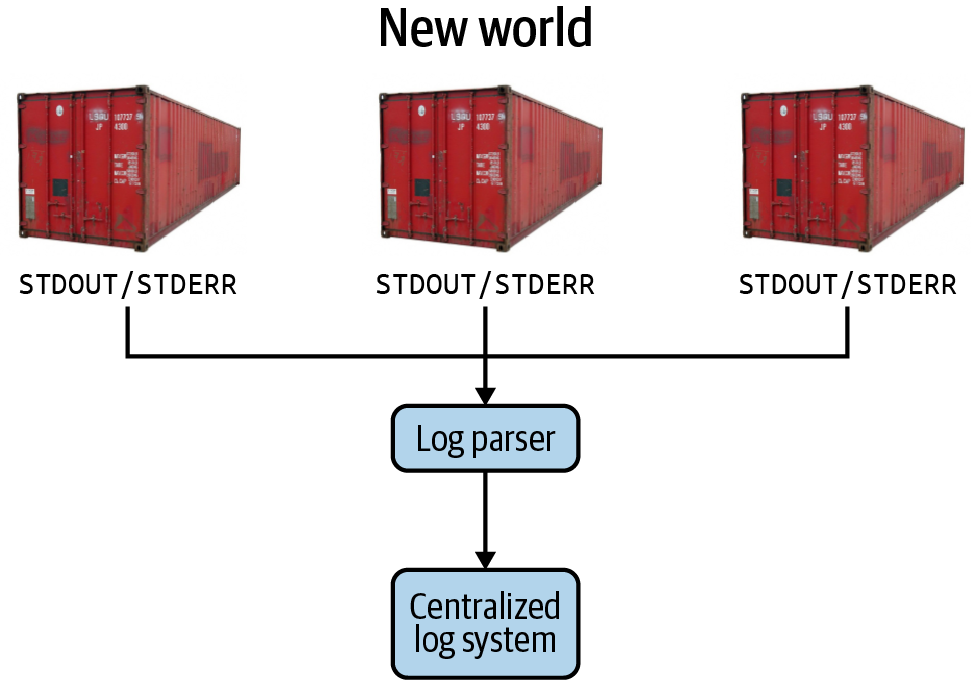
Figure 4-3. Kubernetes opens up new options for centralizing logging infrastructure.
Once the basic architecture is set up, you can tune to your heart’s content. For instance, you might add more custom rules that parse structure out of otherwise flat plain-text logs. You could also set up indexes for fast searching on relevant fields in that parsed structure. Eventually, your team might even consider sophisticated techniques, such as running machine learning on logs, to identify problems before they affect uptime. The centralization of logs has many benefits and, especially since Kubernetes has and encourages a lot more moving pieces than older techniques, will help your team to troubleshoot production issues more quickly.
Scaling
A few options exist for scaling a Kubernetes cluster and the workloads running on it. Usually, you want to focus on scaling out the Pods that define your deployment. To that end, you have the option of vertical scaling, where you increase the amount of resources available for the underlying processes, as well as horizontal scaling, where you increase the number of independent replicas of the service. Horizontal scaling in particular is one of the core tenets of cloud-native applications.
Vertical scaling is the type of scaling you’re likely familiar with from legacy systems. To scale vertically, first you will need to make sure that the underlying machines have resources available to handle it. Once you have confirmed this, you can define new resource limits for the deployment in question and reapply the specification. Kubernetes will automatically take care of terminating the old underpowered Pods and rescheduling the newly beefy Pods where they can claim the resources they need. That method might well take you pretty far on its own, and if you happen to be running in the cloud, it’s probably pretty straightforward to bump up the instance type to accommodate. This can, of course, be done as a rolling operation where Kubernetes reschedules workloads as you power cycle the old machines to change their type.
Unlike the scaling up performed in legacy systems, it’s more likely you will find yourself scaling out in Kubernetes by deploying more replicas across the cluster with horizontal scaling. Using horizontal scaling, you will increase the replica count of your Pods and let the Kubernetes manager do its thing and start scheduling more Pods. Just like simple architecture practices can often end up working fine for a very long time in a web application, this basic framework can get your team very far, and early effort on a deployment is best invested elsewhere. It’s not too hard to know when you might want to scale out when you have good monitoring like we mentioned previously, because your system will be reaching saturation points for metrics like CPU and memory.
Horizontal scaling is particularly fundamental for cloud native applications, and it requires a rearchitecting of applications to ensure that they will continue to perform well under this model. While it may be a bigger lift than the old “throw resources at the problem” approach, it helps improve goals such as availability, reliability, and performance. With horizontal scaling, your system will be able to handle a failure of some parts of the system better. As we have discussed previously, Kubernetes’s rescheduling upon hardware failure hits much less hard in a world where you are not dependent on powerful pieces of specific hardware. Likewise, horizontal scaling can help with performance—an operation slowing the process down in one replica will have a smaller blast radius, and may even get taken out of the load balancing rotation entirely if it can’t respond to its defined probes.
When it comes time to get more sophisticated, Kubernetes has some nifty options on tap. The Horizontal Pod Autoscaler will run calculations based on your system metrics to determine when Kubernetes should go off and scale up on its own without any need for manual operator intervention. As you can imagine, this takes some fine tuning to dial in properly. Set the thresholds too tight, and you’ll suddenly have a much larger fleet on your hands, burning resources that it doesn’t need to. Set them too loose, and the system will be frustratingly sluggish. As with all things, experimentation will help unveil where there might be a good fit for you in autoscaling.
Kubernetes also has all sorts of clever bells and whistles for users to be as specific as possible about how important an application is. For instance, as your team gets more comfortable with resource limits, it might start looking into operations such as setting Pod Disruption Budgets. Pod Disruption Budgets limit the number of Pods of a replicated application that can be down simultaneously. This can help ensure that very critical and sensitive applications continue to run with high availability when Kubernetes’s powerful but aggressive reconciliation magic is happening behind the scenes.
Upgrades
Once you have a Kubernetes cluster that you’re using for real workloads, you’ll eventually have to deal with the topic of upgrading the underlying cluster. Kubernetes is a fast moving project and new versions come down the pike about once a quarter. Your team will need to be prepared to handle the upgrade process, for many reasons from securing vulnerabilities to enabling the latest and greatest features to play with.
What will need to be upgraded, and how should you handle it? The answer to those questions depends on which type of Kubernetes distribution you’re using. A big advantage of a managed or vendor-provided Kubernetes solution is that this can largely be taken care of for you—sometimes without your team even noticing or incurring downtime. In the cloud, providers will often perform such an upgrade for you, or make it as easy as clicking a button. A Kubernetes solution that lives on-premises likely won’t upgrade automatically, but it will provide a clear pathway forward, even if that includes working directly with folks from your vendor to safely roll out the change. There are middle ground options, too, such as using an open source tool that handles some of these processes for you, such as Rancher.
If the cluster was created with a tool like kubeadm, on the other hand, you may be in for a long and multiple step process to properly upgrade the cluster (for instance, you can take a look at kubeadm’s upgrade process). You’ll have to verify which operations are safe to perform in which order (“Can a manager node on this future version operate with worker nodes on previous ones?”), and make sure that workloads are properly drained and separated from the components that are actively changing. You may need to concern yourself with updating a component such as etcd, which is the shared memory system of a Kubernetes cluster. You will also need to religiously stay on top of upgrades over time because skipping a version is likely to result in problems. That’s a lot of work for your team to take on!
Even with the best preparation in the world, things can sometimes go wrong. When you go to upgrade Kubernetes, and in the cluster lifecycle in general, having a clear picture of what a recovery process looks like in the event of a failure is key. We’ll discuss how to think about handling that in the next section.
Business Continuity and Disaster Recovery
Your business might be accustomed to doing things a certain way when it comes to business continuity and disaster recovery, but dealing with these in Kubernetes is a totally different animal. Some on your team might claim that disaster recovery planning can be handled simply by snapshotting live VMs. Backups are certainly necessary, but not sufficient. It makes sense to have a snapshot of things like a database’s state, but what happens when you need to restore it? Is your team prepared for that, and have you done a restore lately to verify that it’s possible? Snapshots might have been a crutch your team could lean on before, but the concerns when operating a Kubernetes cluster will be different.
Instead of worrying about protecting individual nodes, in Kubernetes you shift your focus to a higher level up. After all, in the case of a node failure in Kubernetes, the Pods will just get rescheduled, and your service will have minimal downtime. You need to have a bigger picture perspective for recovering from disasters. For instance, how many manual steps would you have to take to restore the whole system from scratch? In the cloud, you should be able to get pretty far with the push of a proverbial button. You should be taking the time to root out manually created or administrated components and replace them with automation wherever possible.
You also need to understand what happens in the event of an outage or catastrophe in varied environments and how your team will adapt. Can the Pods from one environment be seamlessly run in another, either by rescheduling or by reapplying your spec? Or do you need to be prepared for additional steps in such a forced migration? Your team should be prepared with automation and runbooks to guide them in the case of such an event. In the next section, you’ll see how following best practices such as GitOps makes this process of redeploying workloads easier, especially stateless ones. This is one of many benefits of the infrastructure as code principle, which we will also discuss.
Lastly, you don’t have to tackle the challenge of Kubernetes backups and restores alone. You don’t need to throw your hands up in the air and eschew backups or disaster recovery simply because your business has switched to Kubernetes and the old ways no longer apply.
Operations and security in Kubernetes, like many aspects of the platform, will reward the careful planner and punish the impatient. So take the time to make sure your Kubernetes cluster is secured, hardened, and operationally sound. It will help you and your team sleep better at night.
Get Overcoming Infrastructure Obstacles When Deploying Production-Ready Kubernetes now with the O’Reilly learning platform.
O’Reilly members experience books, live events, courses curated by job role, and more from O’Reilly and nearly 200 top publishers.

