May 2017
Intermediate to advanced
310 pages
8h 5m
English
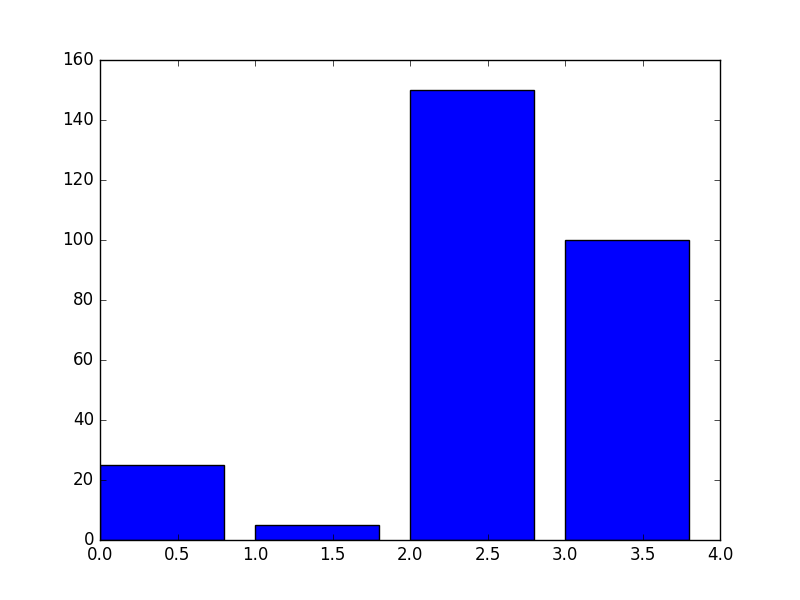
To chart the values 25, 5, 150, and 100 into a bar graph, we will store the values in an array and pass it to the bar function. The bars in the graph represent the magnitude along the y-axis:
import matplotlib.pyplot as plt data = [25., 5., 150., 100.] x_values = range(len(data)) plt.bar(x_values, data) plt.show()
x_values stores an array of values generated by range(len(data)). Also, x_values will determine the points on the x-axis where the bars will be drawn. The first bar will be drawn on the x-axis where x is 0. The second bar with data 5 will be drawn on the x-axis where x is 1:
The width of each bar can be changed by ...