July 2006
Intermediate to advanced
200 pages
3h 24m
English
Use this in conjunction with a timeline to gather data about feelings in a longer iteration, release, or project retrospective.
Show how people experienced events on the timeline.
Five to twenty minutes.
Team members use sticky dots to show events on the timeline where emotions ran high or low.
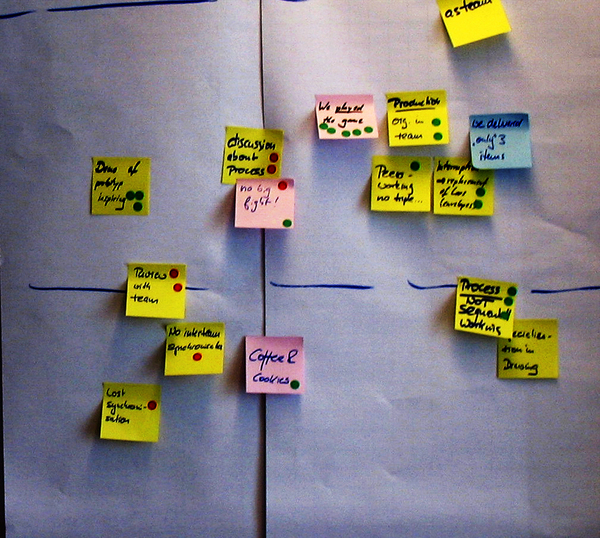
After all the events are on the timeline and the team has done a quick review, individuals use colored dots to show where their energy was high or low (see Figure 8, A timeline with color-coded dots).
Set up the activity by saying “Now that we’ve seen the facts, let’s see how it was to be doing this work.”
Provide each individual with dots in two colors. Start with seven to ten dots per person but have more available. Explain which color indicates high energy and which indicates low energy.
Ask each person to use the dots to show where energy was high and where energy was stalled, flagging, or at low ebb.
Sticky dots 1/2 to 3/4 inches in diameter in two colors.
Decide which color will indicate high energy and which will indicate low energy.
Instead of using dots to indicate high or low energy, use dots to indicate positive or negative events.
When you have limited time, this technique filters topics for discussion: ...
Read now
Unlock full access


