Chapter 1. Sustainability and the Internet
What You Will Learn in This Chapter
In this chapter, we will cover:
A definition for sustainability and the role it plays in business.
How organizations use sustainability principles to innovate, differentiate themselves, reduce waste, and function more efficiently.
How sustainability applies to the Internet.
How virtual life cycle assessments might help web teams devise more sustainable solutions.
A Greener Internet
“The Internet is the single biggest thing we’re going to build as a species,” says Greenpeace’s Gary Cook in an article from The Atlantic.[42] “This is something that if we build it the right way, with the right sources of energy, could really help power our transition to renewables. If we build it the wrong way, it could actually exacerbate the problem.”
This is a book about designing the Internet the right way: efficient, accessible, future-friendly, and powered by renewables.
Building Sustainable Solutions
Throughout this book, we’re going to dive into great detail about all the checkpoints we can put into place to help us make better digital products and services that not only keep users happy and engaged but that are also more efficient and save energy, as well. We will discuss how to translate these checkpoints into an easy-to-understand framework that will help you and your clients make more sustainable design and development decisions.
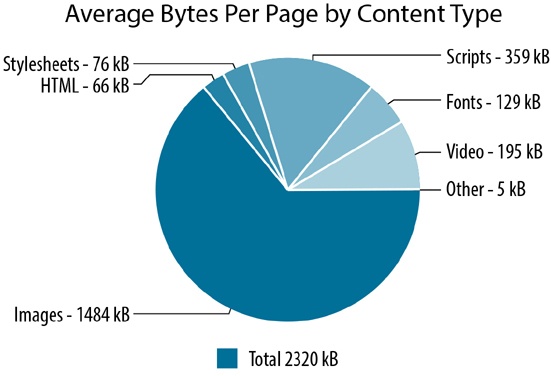
Rarely are the things that we set out to build the things that actually get built. In the maelstrom of changing opinions, validated learning, contractual obligations, and shifting stakeholder requests, we are expected to produce magic. To stay on time, on budget, or on good terms with the person signing our checks, we cut corners. We give in to impractical requests. We let the client autoplay their 30 MB video on the home page. We add an image carousel that over time becomes filled with a dozen photos of generic business people shaking hands. And in turn the average web page size—according to the HTTP Archive, which tracks how the Web is built—rises to more than 2.3 MB.[43]
All that data bouncing back and forth through our networks requires electricity. Energy is used to host our content, serve our content, and interact with our content. Unfortunately, very little of that energy comes from clean or renewable resources. Hence, the Internet, which many people might think is a “green” medium due to the simple fact that it often replaces paper, isn’t as clean as we might think it is. In fact it produces more greenhouse gases (GHGs) than the airline industry,[44] which produced 770 million tons of emissions in 2015.[45] With more than three billion active Internet users in early 2015 and more than half the world’s population predicted to be online by the end of 2016,[46] it is well on track to produce more than a billion tons of GHGs any day now, if it isn’t doing so already by the time you read this.
We don’t mean to build bloated websites that clog networks, waste electricity, and frustrate users. Somehow—be it a desire to try out the latest design bell or programming whistle or the need to keep demanding stakeholders happy—it just turns out that way. If design and development teams could check themselves every step of the way by simply asking “Is this the most sustainable, efficient solution?”, many of these bad decisions—which have detrimental consequences like lost revenue and frustrated customers—could be headed off at the pass. And the Internet would be a cleaner, greener, happier place for all.
But first, let’s offer a bit of context.
Sustainability Defined
The word “sustainability” and its variations are thrown around often, maybe not as much as the term “green,” but still quite a lot. Marketers love using it to describe their products’ virtues. Environmentalists espouse a more hopeful future in its promise. In certain circles, its overuse has perhaps watered down the word’s meaning and trivialized the fact that few things are truly sustainable.
The most commonly quoted definition of sustainability comes from a paper called Our Common Future, released in 1987 by an organization known as the Brundtland Commission,[47] named by the United Nations after the former prime minister of Norway and tasked with the mission of rallying countries to slow deterioration of our environment and natural resources:
Sustainable development...meets the needs of the present without compromising the ability of future generations to meet their own needs.
At the time, the hope of this organization was to reconcile economic development with environmental damage. Nearly 30 years later, this dream of reconciliation between people and planet remains elusive. As Naomi Klein points out in her book This Changes Everything: Capitalism vs. The Climate (Simon & Schuster, 2014):
Our economic system and our planetary system are now at war. Or, more accurately, our economy is at war with many forms of life on earth, including human life. What the climate needs to avoid collapse is a contraction in humanity’s use of resources; what our economic model demands to avoid collapse is unfettered expansion. Only one of these sets of rules can be changed, and it’s not the laws of nature.
Those of us who create the digital future are smack-dab in the crosshairs of this fight between economic expansion and environmental collapse. The rise of the Internet has fueled our increasing demand for products of all shapes and sizes, each of which requires substantial resources to create, transport, use, and dispose of. As we shall see in upcoming chapters, although physical products might require the lion’s share of these resources, digital products and services have their own role to play, as well.
Systems Thinking and Sustainability
Progress has been made since the definition of sustainability was coined. Sustainability is now its own industry, driven by data and chock full of consultants, analysts, corporate social responsibility (CSR) managers, and scientists. Many sustainability professionals have adopted a systems-thinking approach to sustainability rather than view it simply as a compliance or regulation issue, which is common. These people focus on how a company’s systems and its constituent parts interrelate within the larger system of the environment over time.
In describing the definition of sustainability put forth by the Brundtland Commission, the International Institute for Sustainable Development notes that:[48]
All definitions of sustainable development require that we see the world as a system—a system that connects space; and a system that connects time. When you think of the world as a system over space, you grow to understand that air pollution from North America affects air quality in Asia, and that pesticides sprayed in Argentina could harm fish stocks off the coast of Australia. And when you think of the world as a system over time, you start to realize that the decisions our grandparents made about how to farm the land continue to affect agricultural practice today; and the economic policies we endorse today will have an impact on urban poverty when our children are adults.
Using this systems-thinking approach (and others), the sustainability industry has helped many businesses adopt more sustainable practices, resulting in reduced GHG emissions, less waste, more efficiency, and often higher profitability.[49]
Author Nathan Shedroff also covers this extensively in his book Design Is the Problem (Rosenfeld, 2009):[50]
The essence of this definition [of sustainability], which may not be obvious immediately, is that needs aren’t just human, they’re systemic. Even if you only care about humans, in order to care for humans, you need to take care of the system—(the environment) that you live in. And this environment doesn’t include just the closed system we call the planet Earth. It also includes the human systems we live in—our societies—and the forming, changing, and constantly evolving values, ethics, religion, and culture that encompass these societies. We aren’t separable from each other, and we can’t ignore the effects of the whole—nor should we.
To date, few people have applied this same type of thinking to digital products and services. With all of its figures, metrics, and systems-based thinking, the field of sustainability should be a natural fit for those of us who create the nervous system of the 21st century known as the Internet. But what does it really mean to be sustainable? The reality is it’s next to impossible. Few things we humans create are truly sustainable. In a 2004 Grist interview, Patagonia founder Yvon Chouinard noted:[51]
There’s no such thing as sustainability. There are just levels of it. It’s a process, not a real goal. All you can do is work toward it. There’s no such thing as any sustainable economy. The only thing I know that’s even close to sustainable economic activity would be organic farming on a very small scale or hunting and gathering on a very small scale. And manufacturing, you end up with way more waste than you end up with finished product. It’s totally unsustainable. It’s just the way it is.
In the green building movement, some have suggested that we move beyond thinking about sustaining an already degraded planet and more toward regenerative design rather than simply sustainable design. In other words, defining success simply by being impact-neutral is not enough. As a species, we need to renew and regenerate, to change things for the better. According to the folks at Thrive Design:[52]
This entails going even deeper than the leading edge of systems thinking (the uncovering of the interconnected and complex nature of the world) and into the realm of systems being. It recognizes that we are the system, that there is and can never be any separation of humans from the web of life that we wholly depend upon. When we release toxins into the environment, we quickly discover them infiltrating our own bodies through the food we eat, the water we drink, and the air we breathe. In essence, what we do to nature, we do to ourselves. This perspective can help us come to see the planet and its life supporting systems as part of our ‘extended body’. A natural response to this understanding is of care and compassion as it becomes our own self-interest to actively manage the health and integrity of the living systems that we rely upon.
This switch from focusing on outcomes to focusing on process is one that fits well within the context of this book. Startups, digital agencies, and software companies are consistently moving toward models of continuous deployment, where the features and functions of product releases are ongoing and the systems built are actively managed much like those mentioned before. When we talk about designing greener digital products and services, we do so with the idea that the Internet will never be a truly sustainable place. It will always use resources. There will always be work to do. If you have ever designed a website or mobile app, you know that meeting the needs of the present without compromising those of the future is a monumental challenge indeed. After all, when was the last time you played a Flash game on your phone?
Sustainability in Business
Designing greener digital products and services requires us to better understand the role of sustainability in business as a whole, for it is into these systems and processes where we will plug our own work. Although it might not be the norm today, assessing the impact of a company’s digital products and services will hopefully be just one common future component of greater sustainability initiatives in business.
The ways in which sustainability concepts are used in business are so broad they can be hard to encapsulate in a single chapter overview. Different companies take different approaches, use different tools, and focus on different things based on the resources available to them and what they want to achieve from their efforts. Each organization tends to chart its own course using its resources, tools, and goals as drivers. Some focus on energy efficiency, others on waste reduction. Some companies are driven by marketing goals, whereas others use principles of sustainability to drive innovation and disrupt industries. Some focus on a triple bottom line that pays equal attention to people, planet, and profit. The best-in-class do all of the above.
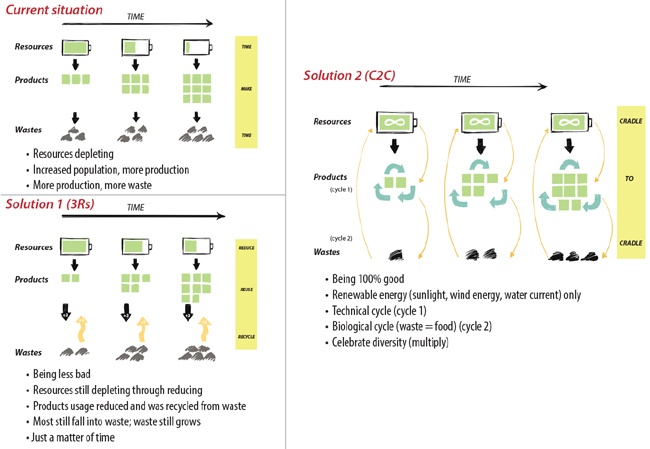
Cradle to cradle (C2C), for instance, is a biometric approach to the aspiration of waste-free products and systems design. It models business and manufacturing practices on natural processes and suggests that industry must protect and enrich ecosystems and nature’s biological metabolism while also maintaining a safe, productive, technical metabolism for the high-quality use and circulation of organic and technical nutrients.[53] In other words, rather than producing waste, the traditional waste products at the end of a product’s life cycle are reused to give life to something new or are reintroduced to the life cycle of the original product, creating what is commonly known as a “closed loop” system, where outputs are reintroduced as inputs. Fairphone, a Dutch company that sources e-waste from Ghana for use in its smartphone devices, is a great example of C2C in practice. More on Fairphone in later chapters.
Cradle to grave, on the other hand, refers to a company taking responsibility for the disposal of goods it has produced and is most commonly associated with life cycle assessments, which we cover in the following section.[54] C2C approaches are generally more favorable than cradle to grave due to the closed loop system concept mentioned above.
Some companies use a helix of sustainability, another systems-based approach which also maps models of raw material use onto those of nature. The helix guides six categories of key business functions (governance, operations, corporate culture, process, marketing, and stakeholders) through five levels of commitment to sustainable principles (no commitment, exploration, experimentation, leadership, and restoration).[55]

Factors such as number of employees, size of supply chain, financial resources, company mission, and product and service types also play important roles. Some have internal departments to manage these affairs while others hire consultants or firms to assess impact and make recommendations for them.
Because reducing an organization’s existing environmental impact and devising processes for minimizing future environmental impact can take so many forms, let’s explore some of the ways in which this can play out:
Identifying (and, later, implementing) efficiencies
Life cycle assessments (LCAs)
Benchmarking
Marketing, branding, and greenwashing
Innovation and disruption
Although some of these processes do include assessments of electricity used by internal data centers and employee workstations, they rarely take into account energy used by websites, mobile apps, cloud-based services, or other digital products and services. This offers unique challenges and opportunities.
Identifying Efficiencies
Many companies start down the road to greater sustainability by identifying efficiencies that let the organization reduce waste of any form while also saving money. This is the low-hanging fruit to sustainability professionals. These could be efficiencies in electricity use, productivity, process improvements, and so on. This is a practice particularly common in larger organizations, as saving money is an easy sell to shareholders and decision makers. Unfortunately, when organizations just care about cost, they might only identify the lowest-hanging fruit and not do more because the payback is longer for higher-hanging fruit (instead of bundling a mixture of both).
Identifying efficiencies is often part of the larger goal and scope process of a life cycle assessment, discussed in more detail a bit later. To accurately identify efficiencies, companies must first accurately identify sources of waste. Companies need good (and ongoing) measurement for this, which might be easier for energy but more expensive and/or challenging for physical waste.
By assessing the entire life cycle of their products and services, from cradle to cradle, as noted earlier, companies can identify sources of waste, and in turn, identify corresponding efficiencies to improve performance. This is a common workflow in sustainability practices, yet to date very few companies that offer sustainability services or life cycle assessments apply this process to digital products and services. A framework for doing so will be presented later in this chapter and discussed throughout the book.
Life Cycle Assessments
Life cycle assessments (LCAs) are commonly used to calculate the environmental impact of a product or service during its entire lifetime. Also sometimes referred to as cradle-to-grave, or more recently, cradle-to-cradle assessments, as noted earlier, they entail multiple steps:
Goal and scope definition (What are we trying to accomplish?)
Inventory analysis (What are we trying to assess?)
Impact assessment (What is the impact of our inventory?)
Interpretation (What does the data tell us?)
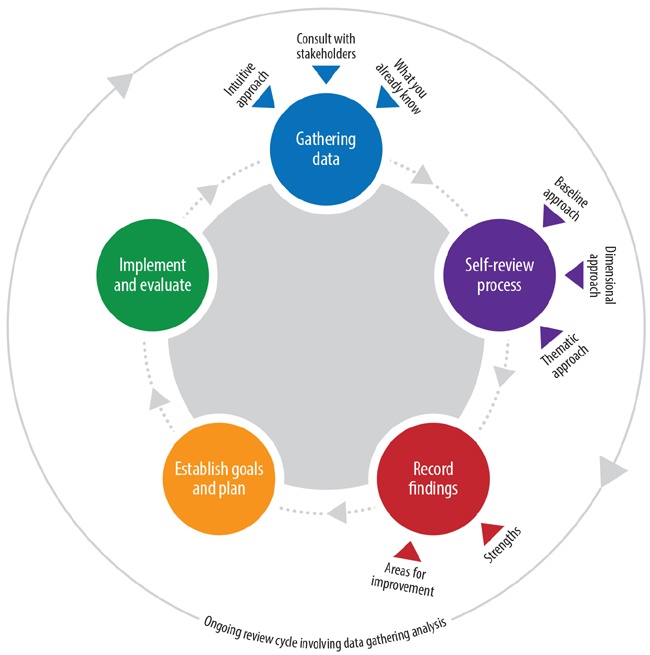
After these steps have been defined, a rigorous process begins to help the company or organization better understand its environmental impact and then devise a plan to do something about it.
To apply these concepts to digital products and services you might answer the preceding questions as follows:
- Goal and scope definition
Define the environmental impact of our online properties and implement a plan for mitigating that impact.
- Inventory analysis
Web, apps, cloud services, social media, and so on—what is included and what isn’t?
- Impact assessment
How much CO2e is generated by these properties? Is there other waste, as well?
- Interpretation
Create a plan to reduce impact—renewable energy, carbon offsets, increases in product/service efficiency, e-recycling, and so on.
Setting goals and scope
It is important with any complex project to set specific goals, timeline, budget, scope of work, and so on. However, enough flexibility should be built into a project’s scope to allow for iteration, experimentation, and the ability to pivot from a specific process should it not yield fruitful results.
We will talk about Agile workflows in later chapters, because they relate to creating more sustainable digital products and services, but it is important to note that building iteration and collaboration into the process of any project is often a more sustainable approach that bears better results than those that require extensive scoping up front with little room for flexibility after a project is in process.
If, for example, the focus of your efforts is solely on greenhouse gases, your scope might look like this:[56]
- Set boundaries
Define an inventory’s physical, virtual, organizational, and operational boundaries. Traditional LCAs are rarely full scope (cradle to cradle) and the assessment can only begin when materials arrive at a company’s gate. Power use for designer workstations, for example, would fall under the scope of a traditional LCA, but if applying this to digital, are you including website or social media, too? If it is in the cloud, is it your problem? How much do you care about frontend, user-driven electricity during product use? For additional considerations, see the sidebar The Power of Users.
- Define scope
Decide which emissions source and/or activity categories should be included in the inventory. Does the scope include both physical and virtual properties? The details you define here will drive the level of effort required.
- Choose quantification approach
Depending on the data available and the purposes of the inventory, define how you will approach collecting data and where it will come from. In a traditional LCA, this might be identifying a source for emissions factors (EFs) and a formula for measuring them.
- Set a baseline
When choosing a baseline—the point that marks the beginning of your measurement efforts—to benchmark progress going forward, consider the following:
Whether the data is available for the time you’ve chosen
Whether the chosen timeframe is representative
Whether the baseline is coordinated to the extent possible with baseline years used in other inventories (if they exist)
- Engage stakeholders
Bring stakeholders into the inventory development process early on to provide valuable input on establishing a baseline. If a specific department or position will be affected by the data derived from this process, it will help to have them on board from the beginning.
- Consider certification
Consider a third-party certification such as ISO 17024, EPt(GHG), or those offered by CSA Group. This will ensure quality and that your inventory is complete, consistent, and transparent.
Inventory Analysis
This is where data collection happens. Life cycle inventories (LCIs) can be complex affairs. Analysts track all of the inputs and outputs to a business system, including (but not limited to) raw materials; energy use; emissions to air, water, and soil (tracked by substance); and so on. The complexity of a company’s supply chain is one of many factors that will dictate the complexity of the inventory.
In Internet parlance, this would be what is commonly referred to as analytics. A popular tool like Google Analytics, for example, offers you all the things you can measure—with the notable exception of electricity use. In the name of efficiency, it is up to you to take an inventory of the metrics you should measure.
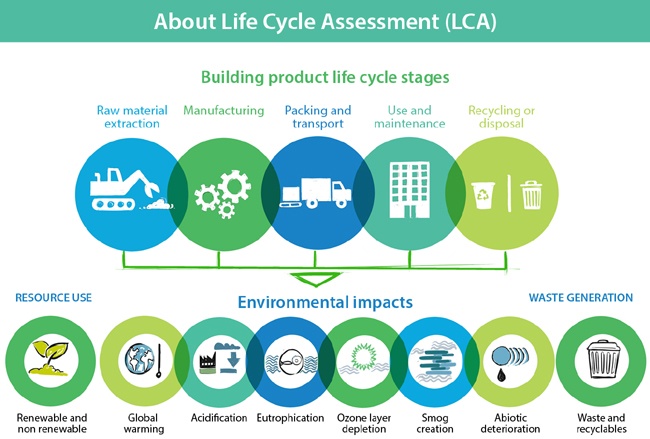
For reference, common components of standard (i.e., physical products) LCIs include materials, manufacturing, packaging, distribution, usage, and disposal. We’ll discuss how to apply these components to digital products and services later in this chapter. For each of these components, consider the following questions:
- Materials
What are the materials used to make the product? Where are they sourced from? How much energy is used in that process? How much emissions are produced in both sourcing and creating the materials? How can they be made or sourced in a more sustainable manner?
- Manufacturing
How much energy does the manufacturing process use? How much waste does it produce? Where can you reduce emissions in the process?
- Packaging
What materials are used in the product’s packaging? Does the product use soy-based inks or compostable materials, for example, versus a less sustainable equivalent? How much energy is used in the packaging process? What about waste? Can that be reduced at all?
- Distribution
How much energy is used in the process of distributing the product? Does it need to be shipped in a cargo container from China or can it be walked down the street to the store where it is sold? How much waste or emissions are produced when distributing the product?
- Usage
Does the product require energy when being used? Is waste produced? How can product usage be more efficient in energy consumption? How can it produce less waste?
- Disposal
When the product is disposed, can its materials be reused? Are there ways in which it can produce no waste at the end of its life cycle?
Impact assessment
This process, also part of a full LCA, is where the data collected is analyzed and the impact of a company’s product or service assessed. In other words, a certain manufacturing process might require a specific amount of oil or natural gas, something that is typically included as part of the inventory that we just discussed. The impact assessment will decipher the environmental effect of that process. For digital products and services, an assessment will use data pulled from analytics tools to gauge a product or service’s environmental impact.
Interpretation
Finally, all that data needs to be interpreted and a plan of action put into place to decrease environmental impact. This includes sourcing renewable power, increasing energy efficiency, reducing waste, and in general making the company’s supply chain—including its digital products and services—more sustainable.
The Greenhouse Gas Protocol
An important part of an LCA is calculating GHG emissions. As emissions from electricity use can comprise the majority of a digital product or service’s waste, this is critical to successfully analyzing their impact. The Greenhouse Gas Protocol from the World Resources Institute serves as the foundation for nearly every GHG standard and program in the world. It is the most widely used international accounting tool for government and business leaders to understand, quantify, and manage greenhouse gas emissions across a product’s life cycle.
Product life cycle emissions are all the emissions associated with the production and use of a specific product, from cradle to grave, including emissions from raw materials, manufacture, transport, storage, sale, use, and disposal.
The Greenhouse Gas Protocol can help organizations do the following:[57]
Determine and understand risks and opportunities associated with value chain emissions.
Identify GHG reduction opportunities, set reduction targets, and track performance.
Engage suppliers and other value chain partners in GHG management and sustainability.
Enhance stakeholder information and corporate reputation through public reporting.
It is also important to note that the GHG Protocol only focuses on greenhouse gases. It is not meant to show an indication of a product’s entire environmental impact, which could include other kinds of waste. Because electricity powers everything on the Internet, its biggest source of waste is GHG emissions, but as we will cover in later chapters, the hardware used to create, serve, and interact with web content produces other forms of waste, too.
Although the Greenhouse Gas Protocol is currently the gold standard, it is also worth noting that the Sustainability Accounting Standards Board (SASB) has a mission to devise sustainability standards for different industries based on accounting standards but for environmental, social, and governance (ESG) issues as opposed to financial performance.
Benchmarking
It should be noted, too, that an important component of sustainability in business is benchmarking improvement. How do you know if you’re improving if you aren’t continuously measuring results and comparing them against the last time measurements were taken as well as against competitors? It is important that companies dedicate resources to these endeavors in amounts appropriate for the organization. Otherwise, initial efforts are wasted and improvement is minimal.
Given the similarity in process between this and many digital endeavors—such as Agile and iterative design strategies, website performance optimization, or digital marketing campaign measurement—one might think there would be more synergy between technology, design, marketing and sustainability departments, but with few exceptions this isn’t often the case.
Which brings us to our next section.
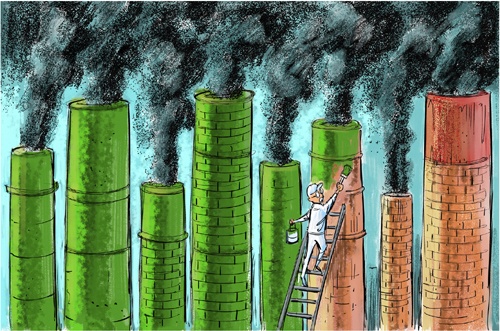
Marketing, Branding, and Greenwashing
Some companies pursue sustainability initiatives to meet marketing objectives or to appease shareholders, customers, suppliers, and so on. If the company doesn’t take its environmental initiatives seriously, this can offer opportunities for what is commonly referred to as greenwashing (discussed in Hardware Disposal on page xxiii). Fossil fuel companies might, for example, spend large sums of money on campaigns about how they’re “going green” even though the product they sell is the biggest contributor of GHG emissions. Examples include “clean coal,” “clean natural gas,” and Volkswagen’s “Dieselgate” emissions scandal (VW engineers intentionally programmed diesel engines to activate certain emissions controls only when the vehicle was undergoing emissions testing, while in real-world driving, the vehicles’ nitrogen oxide output was up to 40 times higher than during tests and were less efficient on performance and fuel efficiency than what the company claimed).[58] Coca-Cola, Air France, BP, and many others have come under fire from environmentalists for touting their commitment to the planet while also polluting or putting people and communities at risk.[59]
“In reality, every company with a green claim is greenwashing,” says sustainability consultant JD Capuano. “Our current economic system is based on unlimited growth, but our resources are limited. Even a company that makes the most responsible products can still have significant environmental impact.”
This is often a design problem as well. Because marketing campaigns are so heavily reliant on good design to communicate their message, designers are often hired to greenwash, and in some cases they might even consider themselves “green” because of their work when in reality that is not the case.
It is up to the individual designer to define where he draws the line in the sand, and for many—especially those who freelance for a living, where a single project could make or break your monthly finances—that can be a moving target. In the early days of my career, I was hired for a motion graphics project that marketed a certain type of cigarette as an active lifestyle brand. Yup, you read that right: snowmobiles, skiing, extreme winter sports, and cigarettes apparently all go hand-in-hand. At the time I really needed the work so I took the gig, but in retrospect it’s one of several freelance projects that, given the chance, I would reconsider. Projects like these inspired me to focus more heavily on doing mission-driven work that mattered as Mightybytes grew and evolved.
Given the lack of consistent, common standards for what CSR or sustainability initiatives should entail and how truly good companies should perform, it can be difficult to discern between a good company and just good marketing. Some companies—sustainable brands, B Corps, and those that subscribe to the philosophy of conscious capitalism, for instance—are able to align profit with purpose in ways that help the company thrive financially while also solving social or environmental problems. By undergoing the rigorous B Impact Assessment, however, only certified B Corps prove that they adhere to higher standards of accountability and transparency, giving consumers confidence that their products and services haven’t been greenwashed. We will discuss this in more detail in Chapter 3 when we cover triple-bottom-line business models.
Innovation and Disruption
Some leaders in this movement are disrupting the status quo with approaches like biomimicry, a process that seeks sustainable solutions to human challenges by emulating the patterns and strategies found in nature. New York–based Ecovative Design,[60] for instance, grows packing and building elements from biodegradable mushroom-based materials (see Figure 1-10) rather than manufacturing them from more environmentally toxic sources. These products can replace polystyrene, a more hazardous material.

Or take Nascent Objects,[61] a more sustainable electronics platform that could disrupt how consumer electronics are designed, manufactured, and sold (see Figure 1-11). Their system of modular electronics components operates on the premise that filling landfills with outdated gadgets or purchasing the latest edition of a device just for a single feature is wasteful. The company’s business model is shaking up the way consumer electronics have been brought to market for the last 60 to 80 years. Rather than releasing single-use products that lock the electronics inside, they have created a system of 15 or so common electronics modules—speaker, camera, microphone, and so on—and made them interchangeable. The result is a system with untold potential and a company whose mission is to create a sustainable electronics revolution.
Choosing from various modules, customers can use the company’s software to create electronics devices specific to their needs, such as baby monitors, WiFi speakers, water meters, security cameras, and more. The company uses 3D printing to create the device’s housing and ships the product to the customer. If a product is outgrown—such as a baby monitor—customers can reuse the internal modules to create something new. So far, the company has designed a water meter, a wireless speaker, and a security camera with many more products in the pipeline

Company founder Baback Elmieh believes that an increase in the number of distributed supply chains coupled with better technology lowers the barrier to entry for designers. Using a system like the one offered by Nascent Objects means that startups can now release products that previously required the work of a much larger company.
It is unclear what happens to device housings once the product is no longer of use—are they sent back to Nascent Objects to be reused? Plus, 3D printing has its own environmental implications: 3D printers can waste about 40% of nonrecyclable materials and because they require keeping plastic materials melted in order to work, they use a lot of electricity.[62] A design shop that keeps them running all day could ostensibly run up a large carbon footprint for each printed piece. Plus, a study from early 2016 showed that some 3D printers emit styrene particles, a possible carcinogen.[63]
Still, given the huge environmental impact of large-scale electronics manufacturing, Nascent Objects’ model offers enormous potential to minimize impact by rethinking the role of devices in our lives, offering solutions with reuse built right into the business model.
Similarly, sensors associated with Internet of Things (IoT) applications offer vast opportunities to monitor energy use and control energy-producing hardware like solar panels. A Nest thermostat, for example, provides consumers with accurate real-time data on energy use, helpful monthly reports, and the ability to turn down or shut off your HVAC system when you’re not home, resulting in significant savings in both energy and money. There are many business applications for IoT tech, as well. We have only just scratched the surface here.
LCAs in Action
In 2014, then New York–based sustainability consultant JD Capuano worked with a well-known online community platform to map out the environmental impact of their business. The goal was to define and quantify the impact, which included estimating the carbon footprint related to running its website—how much carbon was being released into the atmosphere by its servers’ energy use—and devise a strategy for reducing that impact.
Because this company’s primary source of income came from its online platform, it was important for it to include data centers and website performance analysis as part of the process. “Our first step was to interview the head of their data center to understand everything they were doing,” JD said. The company colocated its servers in a few data centers, meaning it shared server rack space with other companies. It also had a number of geographically distributed servers on multiple content delivery networks (CDNs). A CDN caches redundant copies of content on servers in different geographical areas. When users request that content, it is served from the location closest to them, resulting in speedier delivery and less data transmission.
This was helpful in terms of efficiency, but meant that JD had to spend a lot of time collecting data from disparate sources. “The hardest part was getting some form of usable data from the colocated data center host. It required some negotiation. JD then established a regular feed of this information as it came in to his client’s IT team. “The CDNs, on the other hand, were transparent,” he said. “One of them even calculated our client’s carbon footprint and emailed it over.”
JD combined CDN emissions and data center information that was adjusted with partial feeds from power strips that recorded energy the IT Team installed on some racks in the collocated data centers. The power strip feeds let his team quality control the extrapolation method on the provider’s data to estimate a unit emission figure that made sense for the organization.
It is important to note that website and data center analysis were part of a larger sustainability audit that JD did for the entire organization. This included measuring and diagnosing its energy, emissions, water, waste, and purchasing impacts. The emissions included its offices, data centers/CDNs, business travel, employee commuting, and shipping.
Combining the overall data culled from the organization’s efficiency efforts with that of the online components—website and data centers—enabled JD to make overall recommendations for emissions reductions.
Considering this was the first iteration of its platform’s carbon footprint, JD decided to exclude embodied energy—the sum of all energy required to produce goods or services—of the equipment, and the energy required at end-of-life for disposal. Separate from GHG emissions, JD devised a process for measuring waste that included e-waste—electronics hardware and other devices—collected in its offices and colocation spaces. He also ensured that they were using a recycler certified by e-Stewards, an organization that provides globally responsible electronics recycling. Chapter 3 includes more information about e-waste.
To give you an example of how otherwise innovative and sustainable companies can easily overlook the impact of their digital properties, neither Nascent Objects nor Ecovative Design appear to power their websites with renewable energy. Both sites have room for improvement in performance optimization, as well.
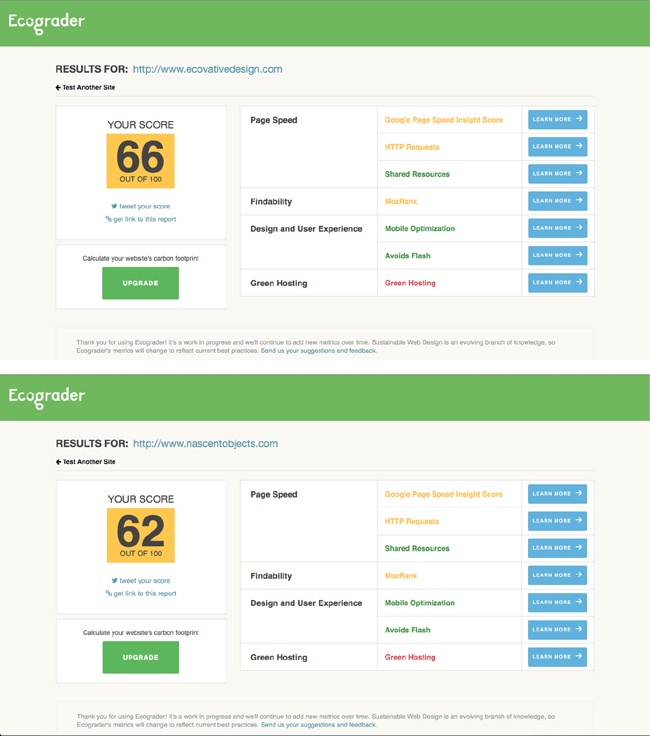
That said, these startups are just getting off the ground, so the small amount of emissions their websites produce is not likely a high priority item for either company. They have many other fish to fry in this early stage of their businesses. However, one hopes that as these companies grow and scale, they will look at the impact of their digital products and services alongside the physical ones. The most sustainable startups will be those that bake sustainable thinking into their business model from the beginning—and that includes considering digital products and services.
Sustainability and the Internet
Now that we have covered a brief overview of how sustainability principles are used in business, how can we apply these practices to the Internet? As mentioned previously in this chapter, when it comes to digital considerations, many life cycle assessments stop at employee workstations and data centers. If we look at where energy is used throughout a web application’s life cycle, however, we can see that energy is needed in three key areas:
The creation, testing, launch, and maintenance of these applications
The hosting and serving of these applications
The download and interaction of users with these applications
Clearly, making data centers and workstations more energy efficient plays a huge role in the aforementioned areas, but it’s not the complete picture. If we want to calculate the environmental impact of a digital product or service during its entire lifetime, we must apply the same LCA process to its entire life cycle, as well.
Let’s look at Internet supply and demand from a very high level. Then, we will dive deeper into how you can create a virtual life cycle assessment for your own digital product or service.
The Jevons Paradox
The Jevons paradox is an economic term coined by 19th century economist William Stanley Jevons to explain how technological progress increases efficiency and also increases demand, and subsequently consumption due to what he called a rebound effect—when something is cheap and convenient, more people want it. Jevons was initially talking about coal use. He observed that when technological advancements increased efficiency and reduced prices, it also drove demand for coal and increased consumption across many industries.
Though Jevons was originally talking about energy, his paradox can be applied to almost any resource and is especially relevant to Internet use. In most examples—such as automobiles or lighting—a convenience factor such as price, availability, location, and so on led to widespread adoption, and in some cases innovation. In the context of this book, when more efficiency leads to more consumption, we get 3+ billion Internet users taking advantage of cheap broadband,[64] inexpensive netbooks, and of course the now ubiquitous smartphone. This number is growing exponentially with some people predicting that the entire world will be online by 2020.[65] Widespread adoption always has impact. The choices we make to buy a cheaper soda, drive a roomier car, or get faster access to the Internet have consequences when they’re amplified to include even half the world’s people. When you consider the amount of virtualization—migrating offline processes online—that global businesses are currently undertaking, the impact is significant. Though these migrations will themselves ostensibly reduce CO2e emissions, they also have an effect of their own, which is often overlooked.
IoT
Similarly, the IoT will see 50 billion connected devices by 2020, or about 7 devices per person on the planet, according to a popular report by DHL and Cisco.[66] Gartner put the number closer to 20 billion devices.[67] Whether it’s a car self-diagnosing faulty brakes or a chip in your pet’s collar that texts you Fluffy’s location when she has run away, anything that can be assigned an IP address and transmit or receive data is a “thing” in IoT parlance.
The consumer-side promise of the IoT is that its smart, self-aware nature will help people make more responsible choices in real time. On the business side, industrial automation—in everything from traffic lights to buildings—while less visible, will save significant amounts of electricity. Remote monitoring will also save on transportation costs and their accompanying emissions.
“If we can put computing into goods so they can self-describe, and provide access on how to safely dispose of them—where ‘dispose of’ means return for recycling, or remanufacture, or reuse,” says Chris Adams from Product Science, a London-based digital agency that works primarily with organizations working on social or environmental problems as part of their business, “then we have a chance to close a lot of extremely wasteful flows of resources.”
This is all great for the environment. There are, however, some significant concerns as well:
Manufacturing all these often disposable devices expends large amounts of energy and uses potentially hazardous raw materials or conflict minerals.
It is very difficult to gauge the overall footprint of a device because often its components are created in many different places.
Whereas some, some devices, such as the Nest thermostat (discussed in more detail in a moment), use features and UX to save energy, others, such as fitness monitors or home automation systems, can have much heavier energy footprints.
IoT devices will often replace older devices, which need to be disposed of. Also, the sometimes disposable/replaceable nature of these devices—their “planned obsolescence”—means that they might end up in a landfill. Some companies even build in self-destruct functionality for security purposes so that a device can’t be used after a certain date.[68]
Each device transmits and receives information to a server somewhere in a data center, which requires power 24/7/365. Few of these data centers are powered by renewable energy.
“This ubiquity is a double-edged sword,” Chris says. “Computing is now cheap to the point that chips are disposable, so we need to provide other reasons to make them last beyond them just being expensive to deploy, or possible to biodegrade in some safe fashion.”
Though all of these Things on the IoT will ostensibly give us better analytics for identifying efficiencies and making more sustainable choices, they also require power sources to continue transmitting and receiving data in real time. As mentioned previously, these devices offer unprecedented possibilities for monitoring and controlling energy use, but current IoT standards are scattered at best and very few of the device manufacturers are collaborating to fix the issue. So, although it’s great that we can monitor energy use, the lack of data standards can make for unnecessary transmission of information. This makes for a rather significant sustainability challenge when it comes to electricity use. Networks, too, will need to be very robust to accommodate this rapid growth in data transmission.
If you own seven of these devices, for example, and none of them talk to on another, there is likely great redundancy in data transmission as each device transmits and receives in its own proprietary format. While Apple—with its HomeKit framework—and a few others are making in-roads to developing common hardware and software standards for these devices, it is still very much the Wild West, with many companies working in silos. To develop a more sustainable IoT, companies must work together to devise common standards that will streamline data transmission and alleviate redundancies.
There is, however, a great untapped opportunity in IoT to help consumers make more sustainable choices through UX practices when creating interfaces for these devices, as in the case of the Nest thermostat (Figure 1-13).
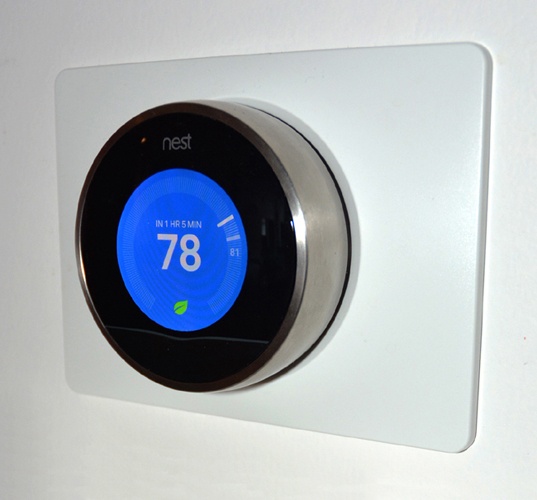
Human behavior is modified more by immediate feedback rather than delayed feedback. Take your electricity bill, for example. You are far less likely to modify electricity use when you receive the bill only every 30 days after you’ve already used the electricity you pay for. The Nest thermostat, on the other hand, not only detects your presence in a room and makes temperature adjustments accordingly to minimize electricity use when you’re not around, it also shows a handy leaf icon when you adjust the thermostat to a more energy efficient setting. This instant feedback helps customers make more informed and energy efficient choices.
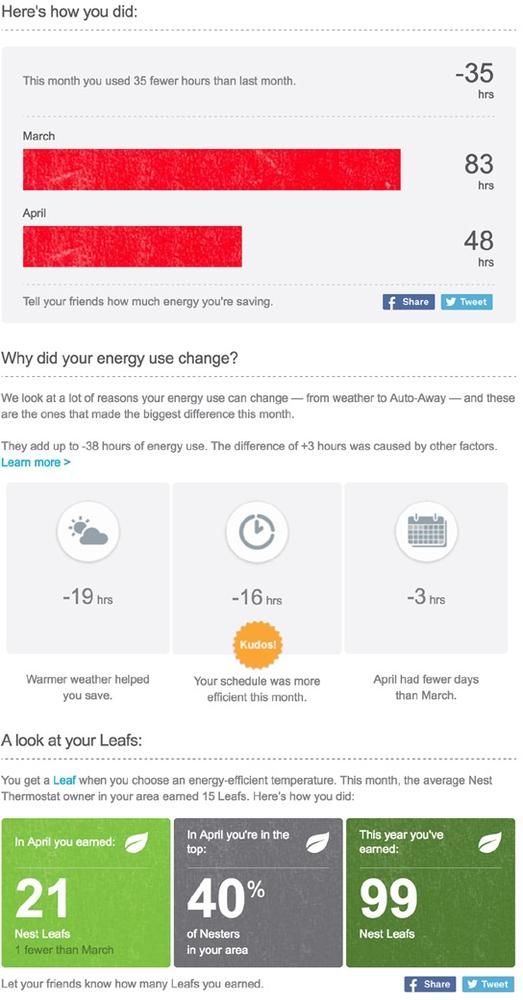
If immediate feedback isn’t enough, Nest also sends a monthly report (Figure 1-14) via email that not only includes information about your own usage, but also compares it to other Nest users in your area, incentivizing cost and energy savings.
Although Nest’s use of iconography, real-time feedback, and incentives offer great lessons in creating more sustainable user experiences, there are others, as well. We will cover more on sustainable UX practices in Chapter 5.
Runaway Page Growth
As global Internet usage has grown, so too have our apps and web pages. As mentioned previously, the average web page size as of this writing is 2.3 MB, more than 24 times the size it was in 2003.[69] When served up on sluggish Internet connections to mobile devices with slower processors, these pages waste time and energy and frustrate the bejeezus out of users. Our love affair with video backgrounds, multi-image carousels, complex social-sharing features, high-res images, rotating banner ads, and other frontend bells and whistles has caused an epidemic of slow, overloaded pages. Meanwhile, many studies have shown that users are unlikely to wait more than a couple seconds for a page to load. There seems to be a bit of cognitive dissonance happening here.
Chapter 6 is devoted entirely to helping you optimize pages for better performance and faster delivery.
Video Streaming
Let’s not forget one of the most bandwidth-intensive uses of the Internet to date: streaming media. Consider these statistics:
With more than 1 billion users as of this writing, YouTube alone streams hundreds of millions of hours of content each day. 300 hours of video are uploaded every minute. Still, according to broadband Internet tracking firm Sandvine, YouTube made up about 18% of overall Internet downstream traffic at the end of 2015.[70]
Netflix use, on the other hand, made up about 37% of all Internet downstream traffic.[71]
Amazon video comprises slightly more than 3%.
In all, video streaming services like YouTube, Netflix, Hulu, Vudu, and others already make up more than 70% of consumer Internet traffic.[72] In 2013, Cisco said streaming video was expected to grow to 76% by 2018 but by current numbers, that estimate might be quite low.[73] One can see why it is important that the electricity used to power these services is generated by renewable sources. Currently, there are big drawbacks to that, which we will cover in more detail in Chapter 3.
Progress is being made on this front. In 2013, according to Google Green, Google’s website on its environmental impact, 35% of the company’s energy came directly from renewable sources, leaving 65% provided by other nonrenewable resources. Greenpeace’s 2015 Clicking Clean report, which bills itself as a “a guide to building the green Internet” put that number at 46%, with 15% coming from natural gas, 21% from coal, and 13% from nuclear sources. Google claims to offset its nonrenewable power sources, but as we will see in Chapter 3, renewable energy credits have their own set of drawbacks. Still, with more than $2.5 billion worth of investments in renewable energy projects and a commitment to 100% renewable power by 2025, it is one of the largest corporate investors in renewable energy in the world.[74]
Another example: Netflix and several others such as Vimeo, Vine, and SoundCloud use Amazon Web Services (AWS) to host their content, as do hundreds of other popular apps we all use, like Dropbox, Pinterest, The Huffington Post, Yelp, Reddit, and so on. In fact, a 2012 study by Deepfield noted that one-third of all Internet users will access an AWS-hosted site or app on average of at least once per day.[75]
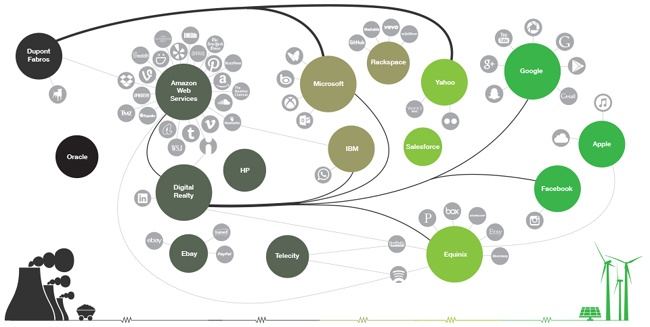
This can be problematic for sustainability purposes because AWS has consistently come under fire by Greenpeace and other organizations for its lack of transparency about energy use and sources. Though it has made a long-term public goal to be 100% renewable energy powered, the lack of transparency from AWS makes it difficult for the public to ascertain how it will actually accomplish this goal, leading Greenpeace to grade the company with C, D, and F ratings across its 2015 Clicking Clean Scorecard.[76]
With more than 60% of the Fortune 100 having carbon and renewable energy goals in place, the company’s lack of transparency will likely become of larger concern to their customers.[77] But they are not the only player for which this has become an issue. As you can see from the chart in Figure 1-15, other companies such as eBay and Digital Realty, which hosts LinkedIn, have a ways to go, too.
When you couple the meteoric growth of streaming video with the lack of transparency and available resources for hosting powered by renewable energy, the problem becomes crystal clear. Again, Jevons paradox in action.
Virtual Reality
With the release of devices like the Oculus Rift, Sony’s PlayStation VR, and others entering consumer homes for the first time in 2016, virtual reality (VR) has seen a resurgence in popularity that Dr. Jonathan Waldern, a VR pioneer, calls “as big an opportunity as the Internet.”[78] Projected revenue by 2020 is expected to be at $5 billion for sales of virtual reality game content, but that’s just scratching the surface. Projected 2020 sales for virtual and augmented reality content are expected to be at $150 billion.[79] Although traditional game markets make logical sense, online providers like Netflix, Hulu, and Amazon are also reportedly exploring ways to add VR content to their subscription services. This could put significant pressure on already stressed bandwidth.

The ultimate goal of virtual reality is to create as much detail in the rendering of a virtual setting that it is indiscernible from the real thing. This includes visual, aural, touch, temperature, and eventually olfactory details. According to an early 2016 article in Forbes, “humans can process an equivalent of nearly 5.2 gigabits per second of sound and light—200 times what the US Federal Communications Commission predicts to be the future requirement for broadband networks (25 Mbps).”[80] Because it is estimated that the human eye can perceive up to 150 frames per second, “assuming no head or body rotation, the eye can receive 720 million pixels for each of 2 eyes, at 36 bits per pixel for full color and at 60 frames per second: that’s 3.1 trillion (tera) bits!”
We’re not there yet, of course. And although compression algorithms can reduce some of this, for VR to realize its true potential, the fact remains that exorbitant amounts of bandwidth will be required to transfer huge data payloads to end users.
According to Dr. Markiewicz:
The game industry, which will have a major role in virtual reality, is not known for efficiency or environmental awareness. The cultural zeitgeist glorifies Hummer computers over Prius rigs, and game design has emphasized ever more elaborate 3D and animation without regard for power consumption. If graphic design has ignored the energy consequences of bad web design, the game industry celebrates its defiance of sustainable norms.
With all this in mind, virtual reality content creators will need to embrace new breakthroughs in performance optimization to maintain a good balance between limited bandwidth, great UX, and optimized performance without latency.
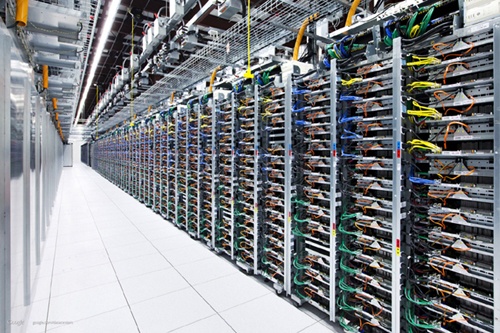
Data Centers
Finally, no discussion of Internet sustainability would be complete without mentioning the power used by data centers. From those owned by large companies like Google and Facebook to the colocated servers used by web design firms and small startups across the globe, every server on the Internet pulls energy from our aging electricity grid 24/7/365. Nearly all of them have redundant methods in place to serve data from alternative sources if a server goes down and to guard against power failures, so these redundancies also require power in addition to that used by their live servers. They also typically have banks of generators—which run on diesel fuel—as backup power sources.
This is important because according to a 2013 post in the New York Times, digital warehouses use about 30 billion watts of electricity, about the same output as 30 nuclear power plants.[81] A single data center can use as much electricity as a small town (Figure 1-17). According to that same article, on average, data centers only use 6 to 12% of the electricity powering their servers for computations. The rest is used to cool servers down, keep them idling, and to guard against surges that could crash their systems. In other words, it is possible that data centers can waste around 90% of the electricity they pull off the grid.
In countries like the United States, only about 13% of the nation’s energy comes from renewable sources, according to the US Energy Information Administration.[82] This includes hydroelectric power, which some environmentalists don’t consider a true renewable source because of the potential damage it can have on natural habitats, but doesn’t include nuclear power (another 20%), which has environmental issues of its own.
When one considers this alongside the 30 billion watts of energy used by data centers, 90% of which is wasted, one can quickly see a picture emerging of an industry poised to be one of the planet’s biggest polluters.
Moving to renewables
Although some of the larger Internet companies like Apple, Google, and Facebook have made huge strides in powering their centers with renewable energy, as of this writing, others, like Microsoft and AWS, still have a ways to go yet. Many cloud providers, like Heroku, as an example, build on top of AWS’s existing infrastructure. In late 2015, Rackspace, which struggled as a competitor to AWS in cloud-based services, followed Heroku and others’ path by offering managed cloud services on AWS.[83]
Similarly, in the world of colocation and web hosting providers, some companies have made strides toward powering their centers with renewables, but many are completely opaque about where their energy comes from, including providers that tout their “green” credentials. This is tremendously important to conscientious designers and developers who want to build environmentally friendly digital products and services. Where we host our apps matters.
We will cover data centers, hosting providers, and renewable energy in more detail in Chapter 3.
Virtual LCAs
Now that we have a better understanding how and where energy is used to power the Internet and a working knowledge of sustainability principles in business, let’s apply the LCA to digital products and services. Remember that list of processes we discussed earlier in the section on inventory analysis? Here is where that specifically applies to digital products and services.
In an article published on Creative Bloq (formerly .Net magazine), Dr. Pete Markiewicz proposed a framework for equating virtual LCAs to their physical counterparts.[84] Components include those listed in Table 1-1.
LCA | Virtual LCA |
Materials | Software and visual assets |
Manufacturing | Design and development |
Packaging | Uploaded to the Internet |
Distribution | Downloaded through the network |
Usage | Interaction, user experience, completing tasks |
Disposal | Data erased from client |
According to Dr. Markiewicz:
Compared to the physical world, sustainable web design will de-emphasise the manufacturing (read production) stage, making it qualitatively different from print design. Why? Unlike physical products, web pages don’t produce waste paper or ink after the page disappears, only heat from the electronics. For this reason, the cost of web page manufacture will be small compared to the cost of ongoing use. On the other hand, the longer a web page is viewed, the more bits it burns, so efficient use based on good user experience will be very important.
Let’s take a look at each of these virtual components individually.
Software and Visual Assets
Rather than asking how much energy a manufacturing process uses, let’s look at the software and visual assets needed to build our digital products and services. If you use cloud-based services, are they hosted on servers powered by renewable energy? If not, do you tend to leave applications open and running in the background on your computer? Many of these applications regularly use network connections to check for updates or provide usage information to the company that created them. When left open, they also use RAM and processing power, which wastes energy.
It can be next to impossible to decipher how energy efficient the creation process of a piece of software is. Did they use Lean Startup principles, creating only what was necessary to validate their product? Or did they load the software package up with features that are rarely used? (I’m looking at you Adobe Photoshop and Microsoft Word.) Are the software company’s offices powered by renewables? Is the equipment energy efficient? The same questions apply to visual assets used during the creation process. It can be challenging to answer these questions, but if we are equating the manufacturing process of a physical product to that of a virtual one, they are worth considering in the name of reducing wasted and emissions.
Design and Development
It is in the design and development of a product where you can make many efficiency gains and energy savings. Strategies like progressive enhancement—an approach that uses feature layering to allow anyone access to basic content and functionality while also providing enhanced features to those with more advanced browsers and/or greater bandwidth—and mobile-first makes digital products and services accessible to more people. Web standards like HTML5 and CSS 3 as well as emerging open source frameworks for virtual reality like WebVR and OSVR will allow for more efficient delivery of content to users across devices. Similarly, accessibility standards for users with disabilities who might need to access your content with screen readers or other assistive technologies will mean that your content can be viewed across a wider array of platforms and devices.
When running an inventory analysis on a digital product’s design and development, some questions to ask include the following:
Does the product use outdated or nonstandard technology that make hardware work harder or requires plug-ins or other additional resources to run?
Is it optimized for mobile devices?
Are images, scripts, and other assets compressed or otherwise “minified” for fastest possible delivery?
Server Uploads, Network Downloads
Our digital products and services might not require packaging or cargo ships to transmit them from place to place, but there is still energy needed to get these applications to their virtual destinies. The US Energy Information Administration estimates that about 6% of electricity used in the United States is lost in transmission and distribution.[85] Typical modernized countries have similar rates between 6 to 9%.[86] In developing countries, it’s another story. In 2000, India lost around 30% of its electricity in transmission, but has made improvements and is currently at about 18%. This is due to the simple fact that by running electrical energy through wires some of it eventually becomes heat.
Designers and developers can create applications that are more efficient and served from computers powered by renewable energy to make this less of a problem. Use of CDNs, by which pages are served from the server closest to the person requesting them can help minimize this, as well.
Thus, when running an inventory analysis on a digital product or service, it is important to ask questions about how much energy is lost in transmission as well as that which is used by infrastructure, bandwidth, and frontend use. Are there ways to reduce those amounts?
Interaction
All digital products and services require energy to run. Interaction represents the most profound way they differ from their physical counterparts, as noted by Dr. Markiewicz’s quote earlier. Question is, how much energy do they use? How can one answer this for a virtual LCA inventory? Here are some questions to ask:
How much traffic does my site or app get?
How much of that traffic comprises computers versus mobile devices?
How much energy do each of those devices use per second? Per minute?
How much data is uploaded/downloaded per device per minute?
What is the average amount of time spent (per device) using my digital product or service?
You can find answers to many of these questions via Google Analytics or other metrics measurement applications.
Disposal of Data
In the inventory analysis for a physical product, one considers how much waste is created and energy used when a product is discarded. Often the focus is on recycling disposed materials. With a virtual product, recycling isn’t an issue, though churn can leave residual data for closed accounts in databases, increasing an application’s size and hence footprint. On the frontend, power is used to delete applications or documents, though that is minimal in comparison to usage and interaction. Also, many online systems, like Git, for example, back up data rather than deleting it. So, if you store thousands of backups, even if only changes are stored, does that increase electricity use and hence environmental impact while also decreasing efficiency? Although disk storage might be energy efficient, backup management might be inefficient. Also, as our applications grow in size and complexity, this can become more of an issue.
Some questions to ask include the following:
What processor resources are required to delete my application?
Does it leave residual information on the user’s device?
How many unused accounts are in the database?
Code obsolescence
Many digital products and services we rely on every day are built on a foundation of obsolete code and outdated proprietary systems, hacked together with the digital equivalent of dental floss and chewing gum. Airline reservations and stock trading are just two examples of large systems our society depends upon to function but which sit upon unstable and outdated code. In July 2015, both the NYSE and United Airlines’ systems went down on the same day (as did the Wall Street Journal, for that matter). Outdated code not only leads to potential security and performance issues, but it also wastes energy and puts your users’ data at risk.
Investing in updates
The importance of keeping hardware/software up to date cannot be stressed enough. Band-aid fixes without the equivalent accompanying architecture planning, budgeting, and so on add more vulnerability to your digital product or service. The duct-tape method of coding new features is unfortunately more common than one might think and is decidedly not a very sustainable approach. In a Medium post about this topic, professor and software developer Zeynep Tufekci, states:[87]
A lot of new code is written very very fast, because that’s what the intersection of the current wave of software development (and the angel investor/venture capital model of funding) in Silicon Valley compels people to do...Software engineers do what they can, as fast as they can. Essentially, there is a lot of equivalent of “duct-tape” in the code, holding things together. If done right, that code will eventually be fixed, commented (explanations written up so the next programmer knows what the heck is up) and ported to systems built for the right scale—before there is a crisis. How often does that get done? I wager that many wait to see if the system comes crashing down, necessitating the fix. By then, you are probably too big to go down for too long, so there’s the temptation for more duct tape.
Also, if you build an application that relies on someone else’s data, keep in mind that every time they update their application programming interface (API), you might likely need to update your application, as well. Sometimes, this will result in features users love no longer being available. A digital product or service will see its life cycle cut short if the software isn’t fast, reliable, and up to date.
When running an inventory analysis on the end stages of your digital product or service, ask the following questions:
How will you keep your application updated, your code lean, and your users’ data secure over time?
How will you add new features that users want while still staying efficient?
When the time does come to finally put your app to rest, how will you do so with as little waste as possible?
What tools can you add to your workflow (e.g., testing modules, real-time performance analytics, hack-ability tests) to improve code quality?
What project management strategies can you implement to prevent waste of coding time, improve bug detection, and stress-test applications during Agile sprints? (More on Agile in Chapter 3.)
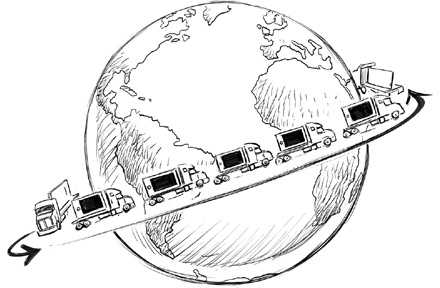
Outdated hardware can have a significant impact on performance, stability, and security. Sometimes, it needs to be replaced and should be done so in a manner in which the hardware components can be recycled wherever possible. As of May 2015, up to 90% of the world’s electronic waste is illegally traded or dumped each year, according to the United Nations.[88] This hardware contains toxic chemicals like mercury, lead, cadmium, and arsenic, which can cause cancer, reproductive disorders, and other health problems. The United States is the world’s largest producer of e-waste, more than one million tons ahead of China. How much waste are we talking about? 41.8 million metric tons in 2014 alone, enough to fill 1.15 million 18-wheel trucks. With the average truck trailer being about 53 feet long, lined end-to-end you could reach nearly halfway around the world with all the e-waste the United States produces in a single year.
Conclusion
The statistics shared in this chapter are meant to give context. The Internet provides great social and environmental benefits by allowing easy access to data and information that was once locked up in processes with far greater environmental impact. (After all, when was the last time you purchased a CD at a record store?) This easy access has empowered nations, enabled communications where previously there were none, and given people in some societies their only access to important information like medical treatment or education.
The solution, of course, is not to use the Internet less. It is to make the system more efficient, power it with renewable energy, and take advantage of it to solve large, global problems like inequality or the climate crisis.
Action Items
Want to explore the concepts outlined in this chapter even further? Try these things:
Create a list of areas where you could have made potentially more sustainable choices on the last project you worked on.
Use the framework in this chapter to run a virtual LCA of a website or application you have either built yourself or use regularly. Identify areas for improvement. Where are there gaps?
Ask your hosting provider what its policy is for using renewable energy to power its servers.
After you have identified areas for improvement, you can use the framework described in the following chapters to begin making your digital products and services more sustainable.
[42] Ingrid Burrington, “The Environmental Toll of a Netflix Binge”, The Atlantic, December 16, 2015. (http://www.theatlantic.com/technology/archive/2015/12/there-are-no-clean-clouds/420744)
[43] HTTP Archive, “Interesting Stats”. (http://httparchive.org/interesting.php?a=All&l=Apr%201%202016)
[44] American Chemical Society, “Toward Reducing the Greenhouse Gas Emissions of the Internet and Telecommunications”, January 23, 2013. (http://www.acs.org/content/acs/en/pressroom/presspacs/2013/acs-presspac-january-23-2013/toward-reducing-the-greenhouse-gas-emissions-of-the-internet-and-telecommunications.html)
[45] Air Transport Action Group (ATAG), “Facts and Figures”. (http://www.atag.org/facts-and-figures.html)
[46] Internet Live Stats, “Internet Users”. (http://www.internetlivestats.com/internet-users)
[47] Wikipedia, “Brundtland Commission”. (https://en.wikipedia.org/wiki/Brundtland_Commission)
[48] International Institute for Sustainable Development (IISD), “Sustainable Development”. (https://www.iisd.org/sd)
[49] Sunmin Kim, “Can Systems Thinking Actually Solve Sustainability Challenges? Part 1, The Diagnosis”, Erb Perspective Blog, Jun 4, 2012. (http://erb.umich.edu/erbperspective/2012/06/04/systems-thinking-part-1)
[50] Nathan Shedroff, Design Is the Problem (Brooklyn, NY: Rosenfeld Media, 2011).
[51] Amanda Little, “An Interview with Patagonia Founder Yvon Chouinard”, Grist, October 23, 2004. (http://grist.org/article/little-chouinard)
[52] Joshua Foss, “What is Regenerative Development?”, Thrive Design Studio. (http://www.urbanthriving.com/news/what-is-regenerative-development)
[53] Michael Braungart and William McDonough, Cradle to Cradle: Remaking the Way We Make Things (New York: North Point Press, 2002).
[54] The Dictionary of Sustainable Management, “Cradle-to-Cradle”. (http://www.sustainabilitydictionary.com/cradle-to-cradle)
[55] The Dictionary of Sustainable Management, “Sustainability Helix”. (http://www.sustainabilitydictionary.com/sustainability-helix)
[56] US Environmental Protection Agency, “Climate and Energy Resources for State, Local, and Tribal Governments”. (http://www3.epa.gov/statelocalclimate/state/activities/ghg-inventory.html)
[57] Greenhouse Gas Protocol, “FAQ”. (http://www.ghgprotocol.org/files/ghgp/public/FAQ.pdf)
[58] Robert Duffer and Tribune staff, “Volkswagen Diesel Scandal: What You Need to Know” Chicago Tribune, September 22, 2015. (http://www.chicagotribune.com/classified/automotive/ct-volkswagen-diesel-scandal-faq-20150921-story.html)
[59] Breena Kerr, “The Culprit Companies Greenwashing Climate Change”, The Hustle, December 6, 2015. (http://thehustle.co/the-culprit-companies-greenwashing-climate-change)
[60] Ecovative Design, “How It Works”. (http://www.ecovativedesign.com/how-it-works)
[61] Patrick Sisson, “Nascent Objects, a Sustainable Electronics Platform, Wants to Make Gadgets More Green”, Curbed, March 11, 2016. (http://www.curbed.com/2016/3/11/11201000/nascent-objects-modular-electronics-sustainable)
[62] Adele Peters, “Is 3-D Printing Better for the Environment?”, Co.Exist, January 29, 2014. (http://www.fastcoexist.com/3024867/world-changing-ideas/is-3d-printing-better-for-the-environment)
[63] Steve Dent, “Study Shows Some 3D Printing Fumes Can Be Harmful”, Engadget, February 1, 2016. (http://www.engadget.com/2016/02/01/study-shows-some-3d-printing-fumes-can-be-harmful)
[64] Internet Live Stats, “Internet Users”. (http://www.internetlivestats.com/internet-users)
[65] Chris Greenhough, “Eric Schmidt Predicts Entire World Will Be Online By 2020”, Inquisitr, April 15, 2013. (http://www.inquisitr.com/618893/eric-schmidt-predicts-entire-world-will-be-online-by-2020)
[66] DHL and Cisco Trend Report 2015, “Internet of Things in Logistics”. (http://www.dhl.com/content/dam/Local_Images/go/New_aboutus/innovation/DHLTrendReport_Internet_of_things.pdf)
[67] The Register, “Gartner: 20 billion things on the Internet by 2020”. (http://www.theregister.co.uk/2015/11/11/gartner_20_billion_things_on_the_internet_by_2020)
[68] Klint Finley, “The Internet of Things Could Drown Our Environment in Gadgets”, Wired, June 5, 2014. (http://www.wired.com/2014/06/green-iot)
[69] Website Optimization, “Average Web Page Breaks 1600K”. (http://www.websiteoptimization.com/speed/tweak/average-web-page)
[70] Emil Protalinski, “Streaming Services Now Account for Over 70% of Peak Traffic in North America, Netflix Dominates with 37%”, VentureBeat, December 7, 2015. (http://venturebeat.com/2015/12/07/streaming-services-now-account-for-over-70-of-peak-traffic-in-north-america-netflix-dominates-with-37)
[71] Sandvine, “Global Internet Phenomena Report”. (https://www.sandvine.com/trends/global-internet-phenomena)
[72] Emil Protalinski, “Streaming Services”. (http://venturebeat.com/2015/12/07/streaming-services-now-account-for-over-70-of-peak-traffic-in-north-america-netflix-dominates-with-37)
[73] Cisco Visual Networking Index: Forecast and Methodology, 2013– 2018 (2014).
[74] Google, “Renewable Energy–Google Green”. (https://www.google.com/green/energy)
[75] Robert McMillan, “Amazon’s Secretive Cloud Carries 1 Percent of the Internet”, Wired, April 18, 2012. (http://www.wired.com/2012/04/amazon-cloud)
[77] Ceres, “Power Forward 2.0: How American Companies Are Setting Clean Energy Targets and Capturing Greater Business Value”. (http://www.ceres.org/resources/reports/power-forward-2.0-how-american-companies-are-setting-clean-energy-targets-and-capturing-greater-business-value/view)
[78] Charles Arthur, “The Return of Virtual Reality: ‘This Is as Big an Opportunity as the Internet’”, The Guardian, May 28, 2015. (https://www.theguardian.com/technology/2015/may/28/jonathan-waldern-return-virtual-reality-as-big-an-opportunity-as-internet)
[79] Janko Roettgers, “Hardware Giants Bet Big on Virtual Reality and a Market That Doesn’t Yet Exist”, Variety, March 22, 2016. (http://variety.com/2016/digital/news/virtual-reality-oculus-rift-consumers-1201735290)
[80] Bo Begole, “Why The Internet Pipes Will Burst When Virtual Reality Takes Off”, Forbes, February 9, 2016. (http://www.forbes.com/sites/valleyvoices/2016/02/09/why-the-internet-pipes-will-burst-if-virtual-reality-takes-off/#774f287064e8)
[81] James Glanz, “Power, Pollution and the Internet”, New York Times, September 22, 2012. (http://www.nytimes.com/2012/09/23/technology/data-centers-waste-vast-amounts-of-energy-belying-industry-image.html)
[82] US Energy Information Administration, “How Much US Electricity Is Generated from Renewable Energy?”. (http://www.eia.gov/energy_in_brief/article/renewable_electricity.cfm)
[83] Yevgeniy Sverdlik, “Rackspace to Provide Managed AWS Services Before Year’s End”, Data Center Knowledge, August 12, 2015. (http://www.datacenterknowledge.com/archives/2015/08/12/rackspace-provide-managed-aws-services-years-end)
[84] Pete Markiewicz, “Save the Planet Through Sustainable Web Design”, Creative Bloq, August 17, 2012. (http://www.creativebloq.com/inspiration/save-planet-through-sustainable-web-design-8126147)
[85] US Energy Information Administration, “Frequently Asked Questions”. (http://www.eia.gov/tools/faqs/faq.cfm?id=105&t=3)
[86] Robert Wilson, “How Much Electricity Is Lost in Transmission?”, Carbon Counter, February 15, 2015. (https://carboncounter.wordpress.com/2015/02/15/how-much-electricity-is-lost-in-transmission)
[87] Zeynep Tufekci, “Why the Great Glitch of July 8th Should Scare You”, The Medium, July 8, 2015. (https://medium.com/message/why-the-great-glitch-of-july-8th-should-scare-you-b791002fff03)
[88] America Upcycles, “About e-Waste”. (http://www.americaupcycles.com/#!e-waste/xx7tv)
Get Designing for Sustainability now with the O’Reilly learning platform.
O’Reilly members experience books, live events, courses curated by job role, and more from O’Reilly and nearly 200 top publishers.

