CHAPTER 44
Chart Library
In closing, I offer the following reference library of long-term charts (
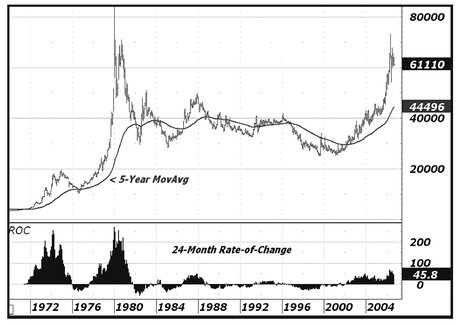
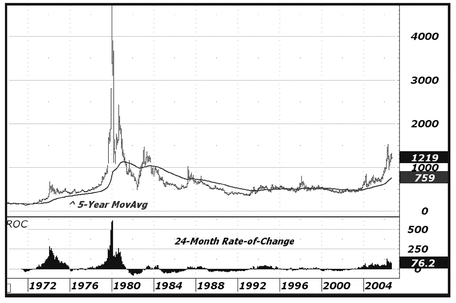
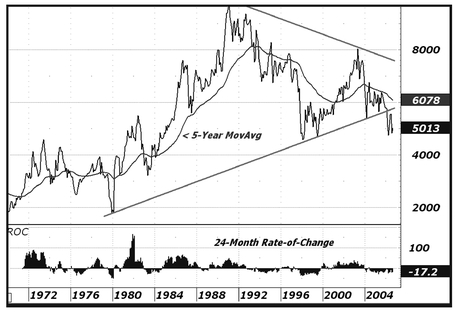
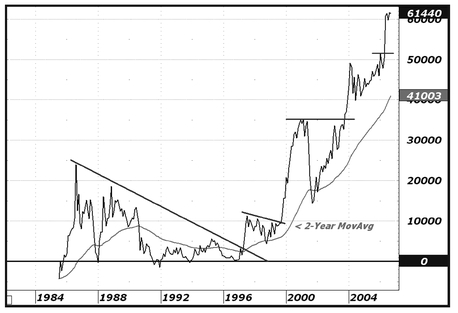
Figures 44.1 through 44.21). They reflect the modern trading era of the precious metals on an outright basis and relative to other asset classes, and gold denominated in global currencies.
Every chart has the same stock technical studies applied allowing for a more accurate comparison, with the following pair of indicators repeatedly visible:
1. Five-Year Exponentially-Weighted Moving Average (60 months).
2. Two-Year Rate of Change (24 months).
FIGURE 44.1 Spot gold (in U.S. dollars): monthly since June 1969
FIGURE 44.2 Spot silver (in U.S. dollars): monthly since June 1969
FIGURE 44.3 Gold-silver ratio spread (spot): monthly close since June 1969
FIGURE 44.4 Platinum minus gold price spread: monthly close since July 1985
FIGURE 44.5 Gold adjusted by U.S. 10-year T-note yield: monthly close since 1969
FIGURE 44.6 Gold versus Dow Jones Industrial Average ratio ...


