March 2018
Beginner to intermediate
576 pages
13h 29m
English
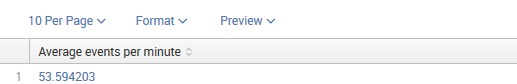
If we take our previous queries and send the results through stats, we can calculate the average events per minute, like this:
sourcetype=impl_splunk_gen network=prod
| timechart span=1m count
| stats avg(count) as "Average events per minute"
This gives us exactly one row:
Alternatively, we can use bucket to group events by minute, and stats to count by each minute that has values, as shown in the following code:
sourcetype=impl_splunk_gen
| bucket span=1m _time
| stats count by _time
| stats avg(count) as "Average events per minute"
We are now presented with a somewhat higher number:
Why? In this ...
Read now
Unlock full access


