122 CHAPTER 4 Feature Selection
0
1
2
0
2
4
22
22
22
21
21
0
1
2
3
Skewness
Mean
Standard deviation
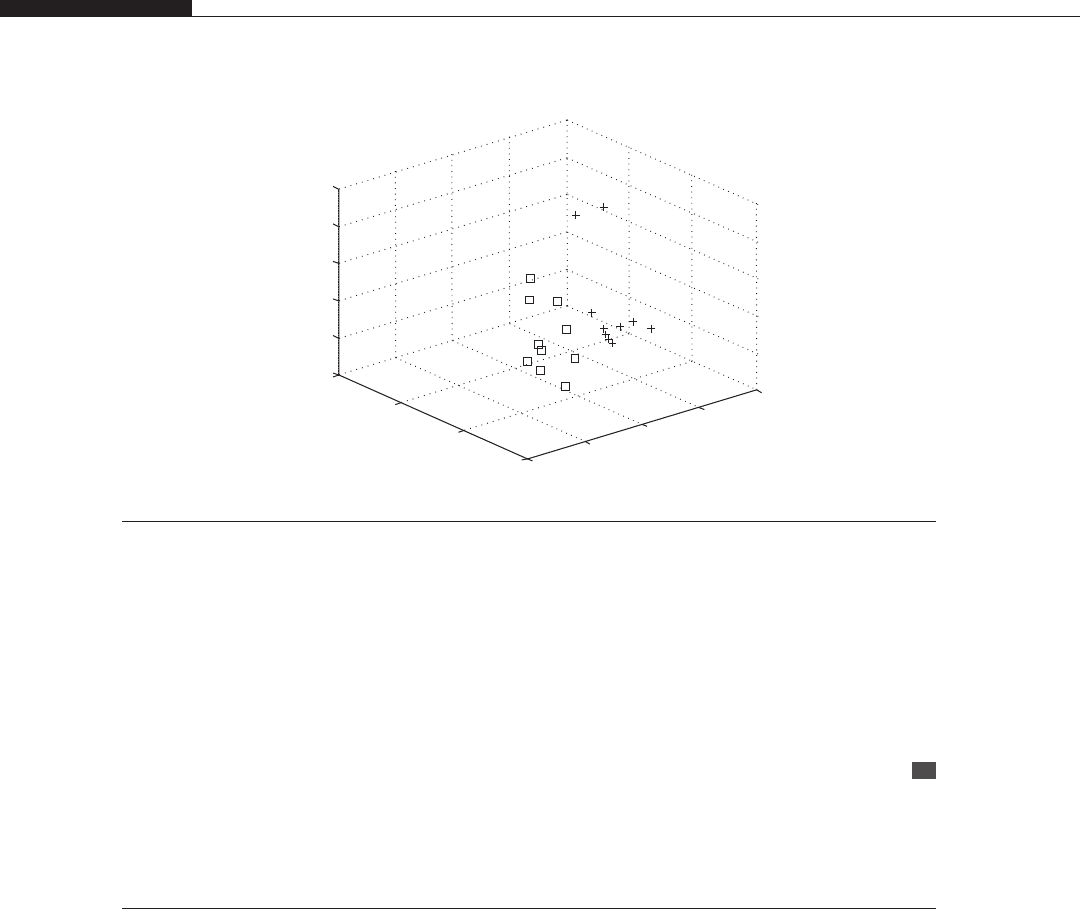
FIGURE 4.5
Plot of the (normalized) 3-feature combination (mean value, standard deviation, and skewness). This
combination leads to good class separation.
Work similarly to evaluate the J
3
for t he remaining 3-feature combinations:[1,2, 4], [1,3, 4], [2, 3,4].
The resul ts are 3.9742, 3.9741, 3.6195, and 1.3972 for the combinati ons [1, 2,3], [1,2, 4], [1,3, 4],
and [2, 3, 4], respectively.
Step 3. To plot the results of the feature combination [1,2,3], utilize the provided plotData function:
featureNames = {'mean','standart dev','skewness','kurtosis'};
plotData(class1,cla ...


