198 CHAPTER 7 Clustering
6 4 2 0 2 4 6 8
4
2
0
2
4
6
(a)
6 4 202468
4
2
0
2
4
6
(b)
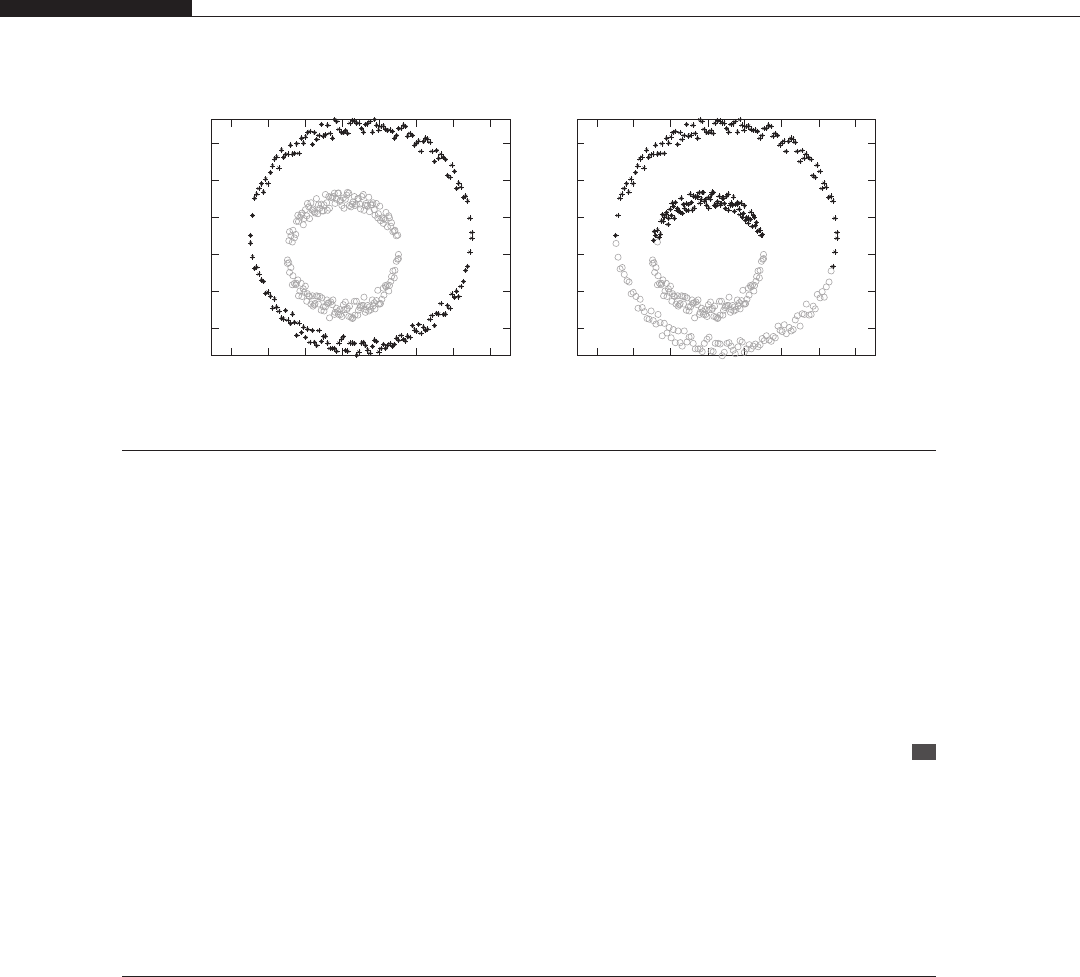
FIGURE 7.10
Clustering resulting from application of the spectral clustering algorithm on data set X
10
in Example 7.6.2 when
(a) e = 1.5 and (b) e = 3. Points assigned in the same cluster are denoted by the same symbol. Observe the
sensitivity in the choice of parameters.
Plot the clustering results (see Figure 7.10(a)), typing
figure(2),plot(X10(1,bel==0),X10(2,bel==0),'ro',...
X10(1,bel==1),X10(2,bel==1),'b*')
figure(2), axis equal
Step 3. Work as in step 2, setting e equal to 3 (Figure 7.10(b)). Comparing Figures 7.10(a) and 7.10(b),
note the influence of the parameter values ...


