134 CHAPTER 4 Feature Selection
0
1
2
3
0
1
2
0
1
2
3
Contrast 0
Skewness
Correlation 0
21
21
21
22
22
22
23
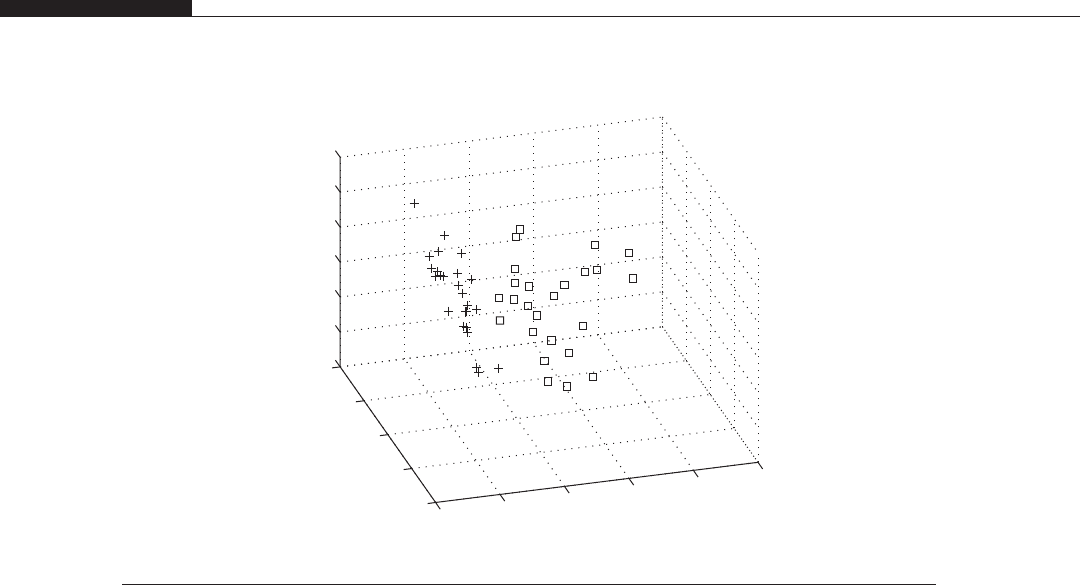
FIGURE 4.9
Plot of the patterns of the two classes, employing a 3-feature combination. Observe that this combination
results in well-separated classes in the 3-dimensional feature space.
'Homogeneity 0','Homogeneity 90','Homogeneity 45','Homogeneity 135'};
fNames=featureNames(inds);
fNames=fNames(cLbest);
plotData(c1_test(cLbest,:),c2_test(cLbest,:),1:3,fNames);
Step 8. Classify the feature vectors of the test data using the k-NN classifier (k = 3) and compute
the classification error. For t hi s, use functions k_nn_classifier and compute_error,whichwere
introduced


