November 2006
Beginner to intermediate
292 pages
7h 26m
English
Critical values of t are shown in Table A.2 for various degrees of freedom (df) The area or probability values (α) to the right of the t-value (see Figure A.2) are shown in the table. For example, with 13 degrees of freedom and 0.025 probability (α) the t-value would be 2.160.

Figure A.1. Area to the right of the z-score
Table A.1. Standard normal distribution
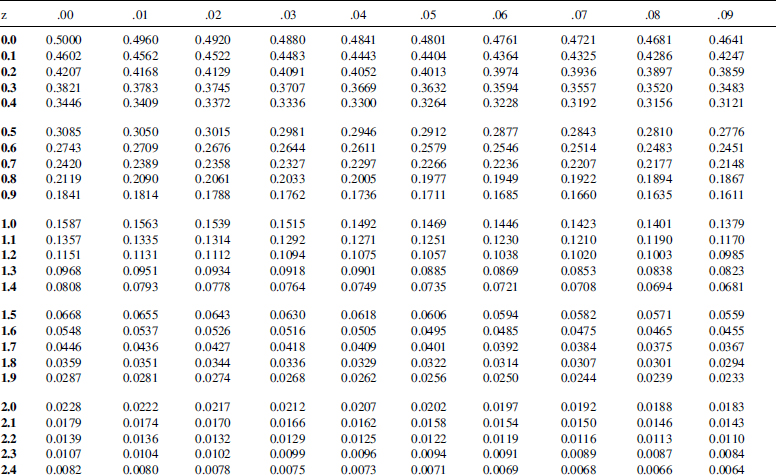

Table A.2. Student's t-distribution


Figure A.2. Area to the right of the t-value
Read now
Unlock full access


