November 2006
Beginner to intermediate
292 pages
7h 26m
English
Tables A.4, A.5, A.6 and A.7 show the F-statistic for four different values of α: 0.1, 0.05, 0.01 and 0.005. v1 is the number of degrees of freedom for the numerator and v2 is the number of degrees of freedom for the denominator. Figure A.4 illustrates the F-distribution. For example, to look up a critical value for the F-statistics where the numerator degrees of freedom (v1) are 6 and the denominator degrees of freedom (v2) are 15 and α is 0.05, using Table A.5, is 3.94.
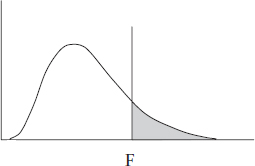
Figure A.4. F-distribution
Table A.4. F-distribution where α = 0.1


Table A.5. F-distribution where α = 0.05


Table A.6. F-distribution where α = 0.01


Table A.7. F-distribution where α = 0.005

Read now
Unlock full access


