CHAPTER 2 New Metrics for Intelligence—Information Yield
Pervasive intelligence pays off, in the form of better insight gleaned from the information resident in your organizational systems. But how do you measure the effectiveness—the yield—of your information, especially across tools and technologies? How do you know if you’re getting the most out of your organizational intelligence?
Over the past 25 years, business intelligence (BI) and analytics technologies have revolutionized business decision-making. Tableau, TiBCO, Qlik, Cognos, and SAS, to name just a few, have all made tremendous strides. Open source has democratized BI applications and models and opened up huge innovation opportunities.
There have also been major advances in visualization techniques, as well as amazing growth in analytic consumables. And then there are the breakthroughs in AI and machine learning, both of which offer incredible promise in establishing situational fidelity and decision lineage in huge, complex enterprises. So why do so many companies struggle to wring value from their analytics programs? Why is it common that 80% of analytics costs consist of building the environment to create value, yet the environment creates no value at all?
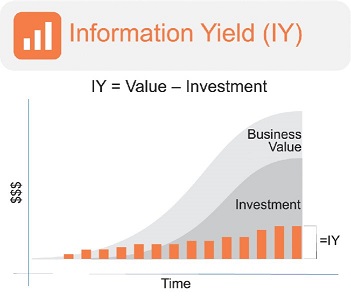
INFORMATION YIELD—THE JOURNEY FROM 2D TO 3D IN ANALYTICS
The problem lies in the fact that the momentum of innovation typically focuses on ...
Get Pervasive Intelligence Now now with the O’Reilly learning platform.
O’Reilly members experience books, live events, courses curated by job role, and more from O’Reilly and nearly 200 top publishers.

