After we have saved the query (and given it a meaningful name instead of New Query; in our case, it's visualizations_by_type), we can create a visualization for it.
The table with the query results inside it is also considered a visualization.
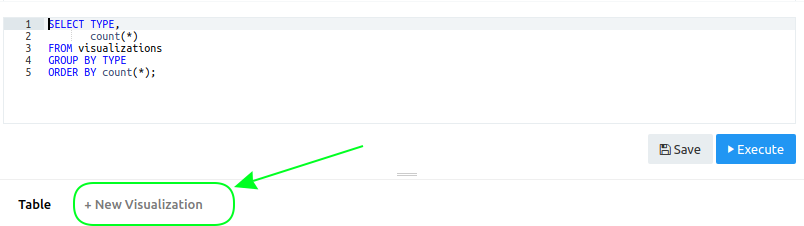
From within the query source (if you're not in query edit mode, click on Edit Source), click on +New visualization:
You will see the Visualization Editor window, where you can the Visualization Type (and optionally give your visualization a name):
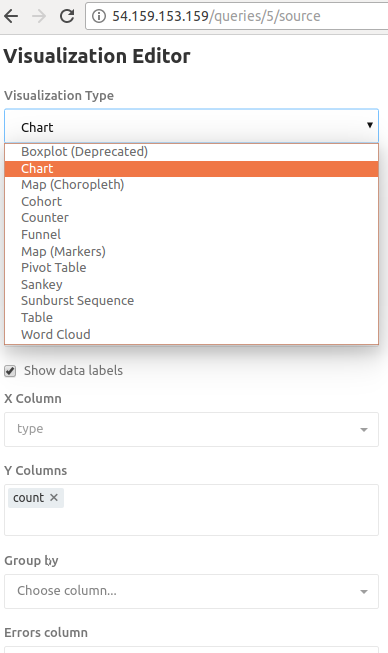
Here is an example of Word ...

