Chapter 23
GRAPHS
M
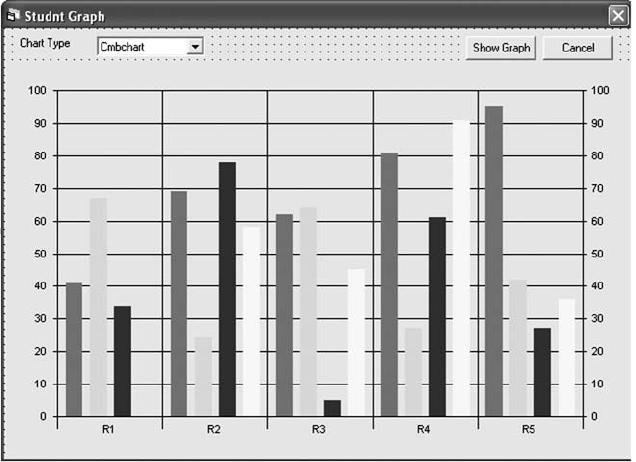
icrosoft has included a chart control in Visual Basic 6.0. The chart control
can be used to present your data in graphical format. The graphical format
of data gives the user a quick overview of the data and information. In
this chapter we will learn how to generate the graph of the number of students
present in each class.
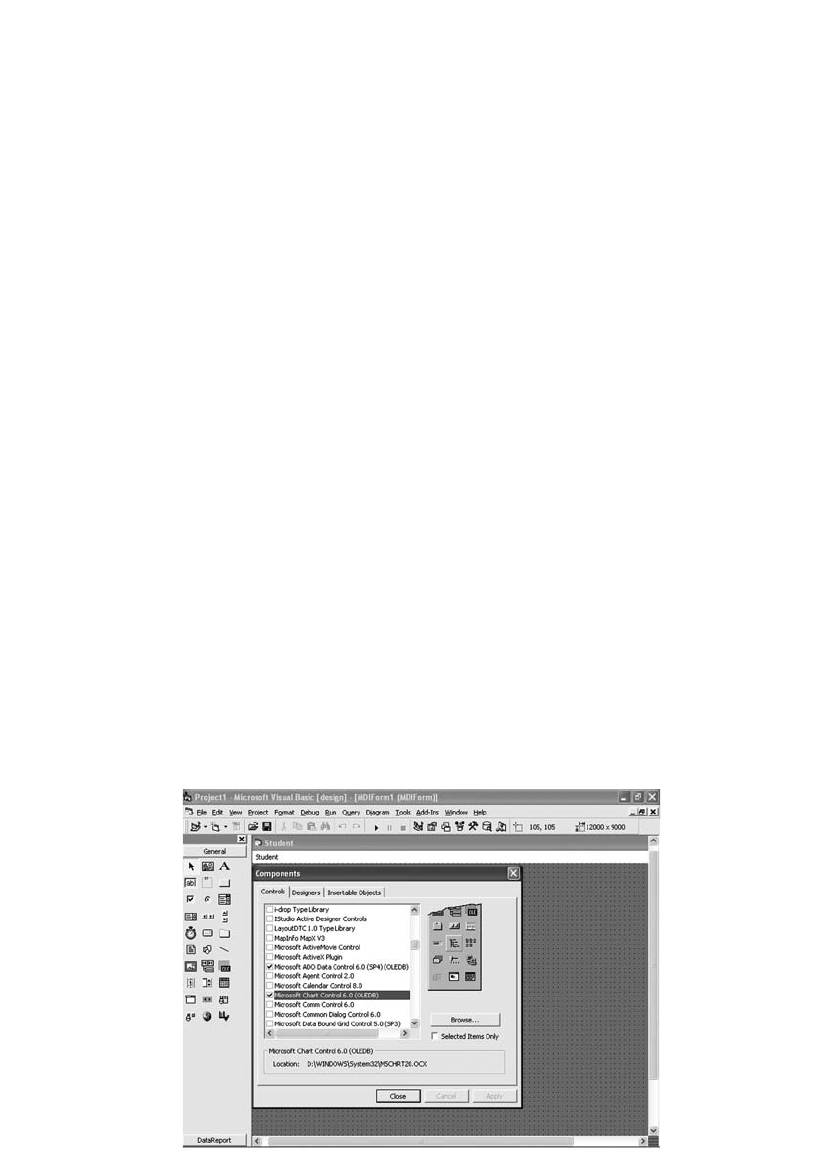
Add a new control, Microsoft Chart Control 6.0 (SP4) (OLEDB), in the School project.
FIGURE 23.1
421