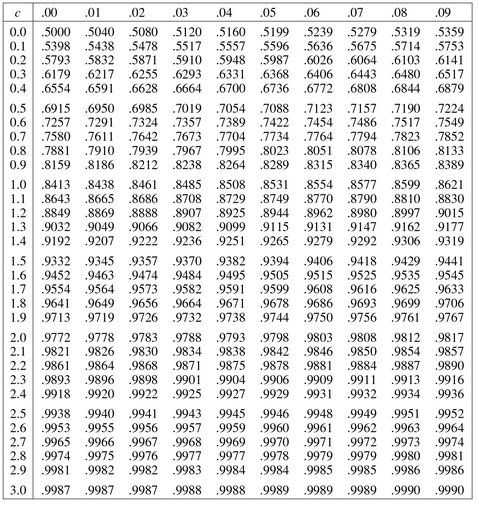
Verteilungstabellen
A Normalverteilung
Verteilungsfunktion ![]() der Standardnormalverteilung. Den Wert etwa für c = 1.16 findet man in der Zeile 1.1 und Spalte.06: Φ(1.16) = 0.8770. Das α-Quantil von
der Standardnormalverteilung. Den Wert etwa für c = 1.16 findet man in der Zeile 1.1 und Spalte.06: Φ(1.16) = 0.8770. Das α-Quantil von ![]() findet man, indem man den Wert α in der Tabelle lokalisiert und Zeilen-und Spaltenwert addiert: Φ–1(0.975) = 1.96; einige Quantile stehen auch in Tabelle C. Für große Werte von c siehe Aufgabe 5.15.
findet man, indem man den Wert α in der Tabelle lokalisiert und Zeilen-und Spaltenwert addiert: Φ–1(0.975) = 1.96; einige Quantile stehen auch in Tabelle C. Für große Werte von c siehe Aufgabe 5.15.

B Chiquadrat- und Gamma-Verteilungen
α-Quantile der ...
Get Stochastik, 5th Edition now with the O’Reilly learning platform.
O’Reilly members experience books, live events, courses curated by job role, and more from O’Reilly and nearly 200 top publishers.

