October 2017
Intermediate to advanced
720 pages
18h 37m
English
The initial adjustment of data is not the end of the adjustment. Rather, it is the beginning of the analysis process. Throughout this book, the mechanics of performing a least squares adjustment properly have been discussed. Additionally, statistical methods were introduced to analyze the quality of observations. As in Chapter 21, this chapter will explore the procedures used in analyzing the residuals of the observations in the adjustment.
![]() The normal distribution and statistical testing were introduced in the early chapters of this book using simple sets of data. These basic concepts also apply in the analysis of data after an adjustment. When viewing Figure 25.1, four guiding principles are used in analyzing observations from normally distributed data:
The normal distribution and statistical testing were introduced in the early chapters of this book using simple sets of data. These basic concepts also apply in the analysis of data after an adjustment. When viewing Figure 25.1, four guiding principles are used in analyzing observations from normally distributed data:
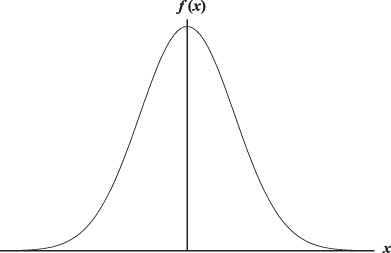
FIGURE 25.1 The normal distribution.
At the conclusion of a least squares adjustment, the residuals in the observations should be scanned and analyzed in an attempt to locate outliers ...
Read now
Unlock full access


