Chapter 18. Diagnosis
IF THERE’S ONE CERTAINTY IN THE LIFE OF A DEVELOPER, IT’S BUGS. AJAX PROGRAMMING ISN’T ROCKET science, but you can still expect the odd moment of pain during development and maybe even in production. Fortunately, there are plenty of techniques, tools, and libraries available to help you isolate problems as they arise. This chapter breaks them into four categories.
Logging is just good old logging applied to the browser, where log messages can be shown in a popup, uploaded to the server, or shown in some browser-specific way. Likewise, Debugging is general-purpose debugging applied to JavaScript that is running within the browser.
The next two patterns are more Ajax-specific. DOM Inspection is about analyzing the dynamic state of the DOM. Traffic Sniffing is about watching traffic between browser and server.
Logging
⊙ Capture, Log, Message, Monitor, Record
Developer Story
Dave’s search engine keeps giving a blank result for certain queries. Fortunately, he previously added some Logging commands to see how the query is processed, so he makes the console visible and sets log level to verbose. After entering the query again, he now sees that one of the regular expressions is not matching the query as expected.
Problem
How can you track program process?
Solution
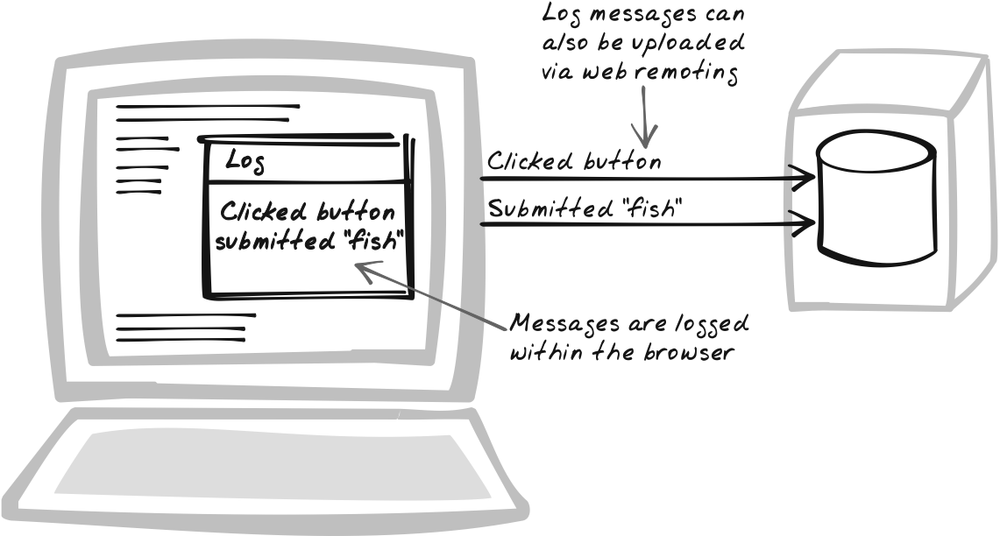
Instrument your JavaScript with log
messages. Typically, the page contains a div element especially for
Logging, and each significant action is
appended there, e.g.:
$("log").innerHTML += "User searched for " + query + ".<br/>";Even this simple implementation offers several benefits over
the common alternative, debugging with an alertbox. Most
importantly, the log element can be a Popup
(Chapter 15): you can easily
toggle visibility by dynamically switching CSS properties such as
display, or even make it partly
transparent. Further, Logging is unobtrusive—that is, there’s no
impact on application flow. Another benefit is that you have a
history to consult if something goes wrong; there’s no need to try
replicating the problem.
Inspired by libraries such as Java’s log4j (http://logging.apache.org/log4j/docs/), JavaScript Logging libraries usually provide some sort of filtering. Typically, a message is tagged with a priority level, e.g., “debug,” or “info,” or “error.” You can then choose to only see messages above a certain level.
Logging impacts performance, not just in DOM manipulation but also in producing the messages themselves. You can end up with a memory problem as well unless some measure is taken to clear old messages, e.g., using a buffer to discard old messages.
Instead of Logging to a console on the page, some developers
output messages to the browser status bar (using window.status), and Firefox developers
also have the option of outputting to the browser console. However,
this limits portability and requires some configuration (http://www.make-believe.org/posts/05/10/24/0).
Another approach that is gaining traction is to embrace Web
Remoting (Chapter 6) and upload
the data to a Logging web service.[*] This allows for permanent storage of the logs and can
also be combined with server-side logs to paint a detailed picture
of each interaction. Eric Pascarello, for example, has proposed the
technique for usability testing (http://radio.javaranch.com/pascarello/2005/11/01/1130878004388.html).
And log4js (http://jroller.com/page/stritti?entry=logging_in_javascript_log4js)
supports an XMLHttpRequest-driven
Logging strategy. The benefits of remote
Logging must be balanced against concerns for users’ privacy and
consent.
Decisions
Will you log during production?
Most servers are configured to perform Logging during production as well as development, so should the browser log too? In the past, the answer was usually no. But Ajax makes the case for browser Logging more compelling for two reasons. Firstly, with more logic in the browser, there are more things that can go wrong and that need to be logged. Secondly, Web Remoting (Chapter 6) makes it possible to accumulate logs on the server in a completely unobtrusive manner. Still, remote Logging does consume application processing time as well as bandwidth, so you’ll need to decide whether it’s worth it, and if so, how much to log. In doing so, you’ll also need to consider the user’s privacy.
How will you change log settings between development and production?
In server-side Logging systems, log settings are usually altered by applying environment-specific filters. For example, in development, all messages are shown, whereas in production, only messages at information level and above are shown. But a familiar performance problem then arises: even though debug messages aren’t being logged, the arguments must nevertheless be constructed, which takes time. A common solution is to include “if-then” statements—an unfortunate idiom that obscures the real point of code—to check the log level. Since JavaScript is generated by the server, you can do better than that: configure things so that log commands aren’t even spit out in the first place. How you do this depends on the server-side environment. For example, a JSP developer could develop a JavaScript Logging tag whose implementation dynamically inspects the Logging configuration.
Tool Support
Lumberjack
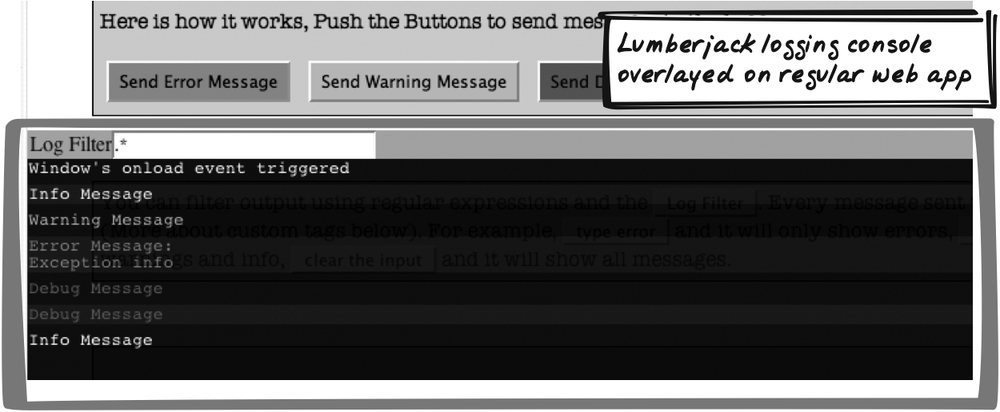
Corey Johnson’s Lumberjack (http://gleepglop.com/javascripts/logger/)
is a JavaScript Logging framework that supports Logging at
different levels. There’s no setup required because it creates the
Logging div itself, so you can
immediately issue calls such as Logger.info("User logged in."). The
console is initially hidden, and you can toggle visibility with
Alt-D.
fvLogger
David Miller’s fvLogger (http://www.fivevoltlogic.com/code/fvlogger/)
works similarly to Lumberjack. To use it, you just include a
div with optional log level and
make calls such as error("No such
record.");.
log4js
log4js (http://jroller.com/page/stritti?entry=logging_in_javascript_log4js) is based more closely on log4j than other frameworks. In addition to various log levels, it supports pluggable Logging strategies. Logging strategies include: do nothing; log to pop-up window; and upload via XMLHttpRequest Call.
Mochikit
Bob Ippolito’s Mochikit framework (http://mochikit.com/doc/html/MochiKit/Logging.html) has an API similar to those mentioned earlier and also adds features such as log listeners and a configurable message buffer. Interestingly, the standard way to launch the console is with a bookmarklet.
Code Example: Using Lumberjack
The Basic Ajax Pattern Reader (http://ajaxify.com/run/reader/) is refactored here to include Logging with Lumberjack (http://gleepglop.com/javascripts/logger/)(Figure 18-2). Lumberjack’s logger.js is included, and the code is then instrumented to include log messages:
    Logger.info("Received " + patternNames.length + " pattern names.");
    ...
    Logger.debug("Received summary: " + summaryHTML.substring(0, 100) + "...");
    ...
    Logger.info("Adding " + patternOption.value + " to playlist");
Debugging
⊙ Break, Debug, Deduce, Fix, Inspect, Repair, Step, Test
Developer Story
Devi is scratching her head, wondering why a particular visual effect is so jerky; instead of growing gradually, the icon transitions from small to large in just a few, erratic, steps. Code analysis is getting her nowhere, so she fires up her JavaScript debugger, which allows her to step through the effect in her own time. After adding the box dimensions to a watchlist, she quickly diagnoses the cause as a number-rounding issue.
Problem
How can you diagnose errors and strange behavior?
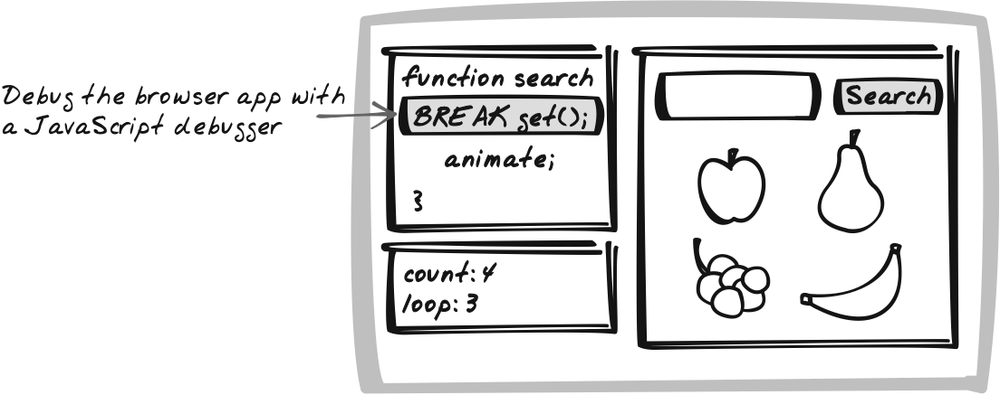
Solution
Diagnose problems with a JavaScript debugger. JavaScript Debugging used to be as sophisticated as adding a few alert messages, but it has come a long way. A tool such as the Venkman debugger (http://www.mozilla.org/projects/venkman/), a popular Firefox extension, makes the point. Venkman has all the basic features you’d look for in a debugger of any language: breakpoints, call stacks, step in/out/over, watches, and error and exception triggers. Also, an interactive session lets you type code for immediate execution as well as basic profiling support.
For basic error reporting without a custom debugger, use
Firefox’s built-in JavaScript Console, and on IE, switch off the
“Disable Script Debugging” options. You can also define window.onerror to show any errors that
arise, as the event handler is notified of the error message, URL,
and line number. You could then perform Logging
or create an alert, e.g.:
  window.onerror = function(message, url, lineNum) {
    alert("Error: '" + message + "'. At " + url + ", Line " + lineNum);
  }
Tool Support
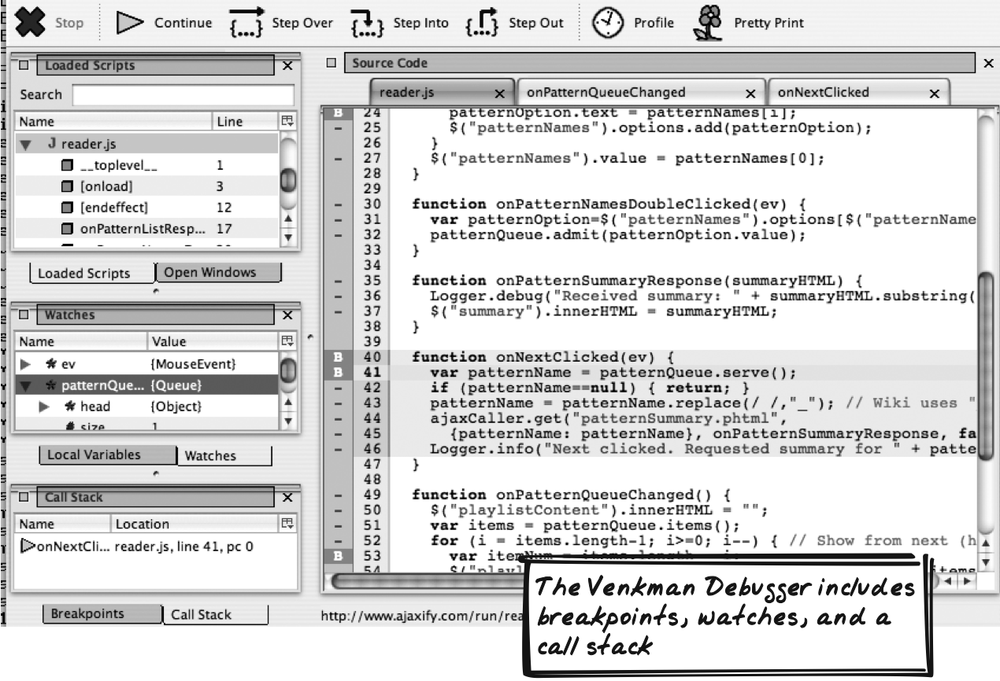
Venkman
Venkman (http://www.mozilla.org/projects/venkman/) is an open source Firefox extension with quite sophisticated Debugging support, as discussed in the preceding Solution (Figure 18-4). When you open the debugger, it shows a list of JavaScript files, which you can then open to set breakpoints.
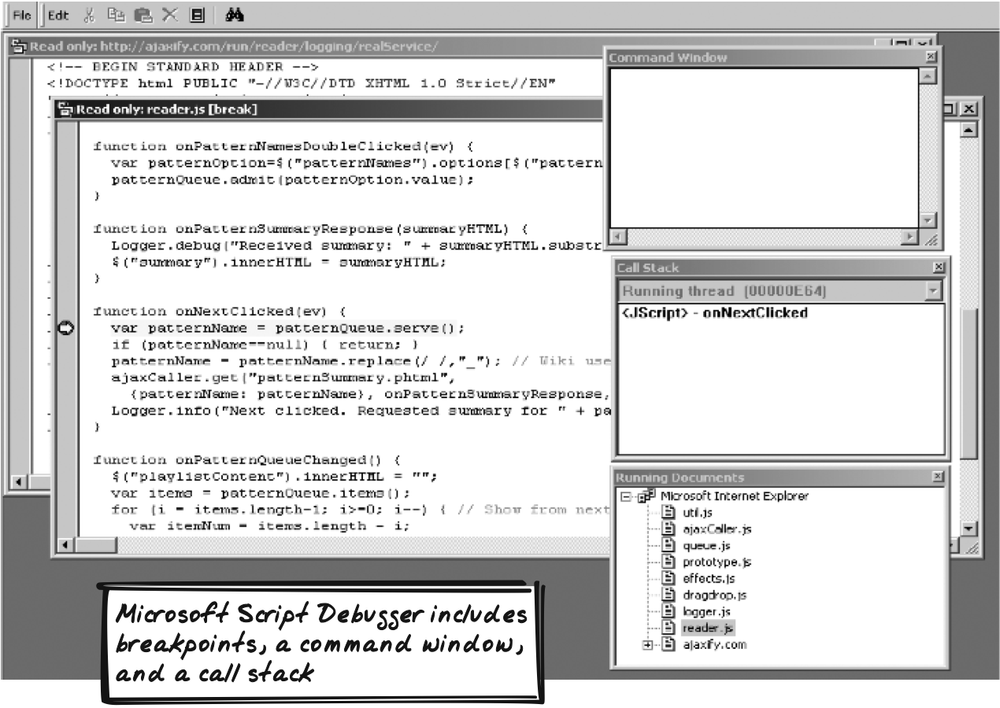
Microsoft Script Debugger
Microsoft makes Microsoft Script Debugger (http://msdn.microsoft.com/library/default.asp?url=/library/en-us/sdbug/Html/sdbug_1.asp) available for no cost. It offers basic Debugging functions, e.g., breakpoints, a basic call stack, step in/out/over, and error triggers (Figure 18-5). While not as feature-rich as Venkman, it’s still useful for investigating IE-specific bugs. The IE Blog (http://blogs.msdn.com/ie/archive/2004/10/26/247912.aspx) lists several options for IE Debugging.
JavaScript HTML Debugger
JavaScript HTML Debugger (http://www.htmldebugger.com/javascript_debugger/javascript_debugger.asp) is a commercial tool from SplineTech. It’s a standalone Windows application with functionality similar to Venkman but a greater emphasis on ease-of-learning.
DOM Inspection
⊙ DOM, Dynamic, Explore, Inspect, Interrogate, Investigate, Presentation, Render, Snapshot, State, View, Visualise, Visualize
Developer Story
Devi keeps clicking on the Clear button, but the document text
remains stubbornly unaffected. She fires up a DOM Inspection tool
and discovers that the button’s onclick event handler isn’t present, which
explains why nothing was happening.
Problem
How can you inspect the DOM’s state at any time, taking into account DOM manipulations that may have occurred since the page was loaded?
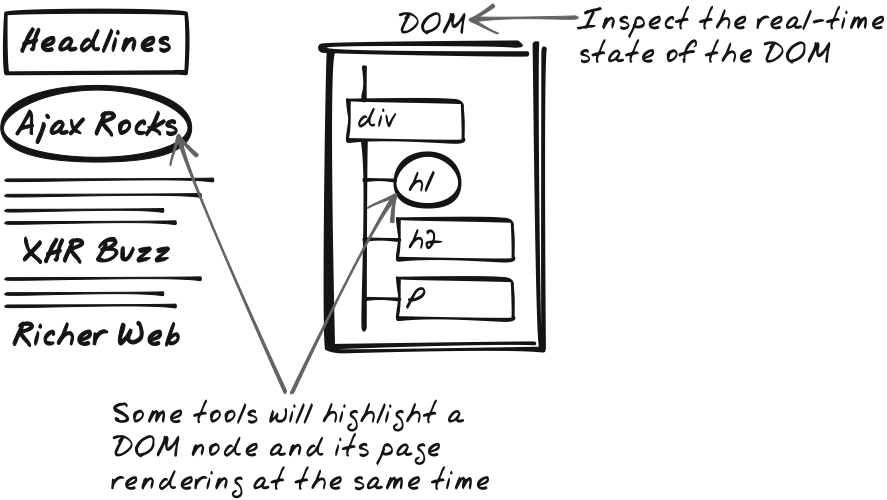
Solution
Use a DOM Inspection Tool to explore the dynamic DOM state. The initial HTML for an Ajax App is often minimal and, in any event, likely to change over time due to DOM Manipulation. A DOM Inspection tool traverses the browser’s current DOM model, rather than the initial HTML source, to build up a presentation of the current DOM. Many times, the tool is interactive, allowing you to drill down the hierarchy, search for keywords, and so on. All of this is very useful for checking assumptions and diagnosing problems, since many Ajax bugs arise because the programmer misunderstood the DOM state at a particular time.
Incidentally, DOM Inspection is useful beyond the fact that the DOM is dynamic. Even for static applications, an interactive exploration tool is often a good complement to the mound of text that makes up a complex HTML document.
Tool Support
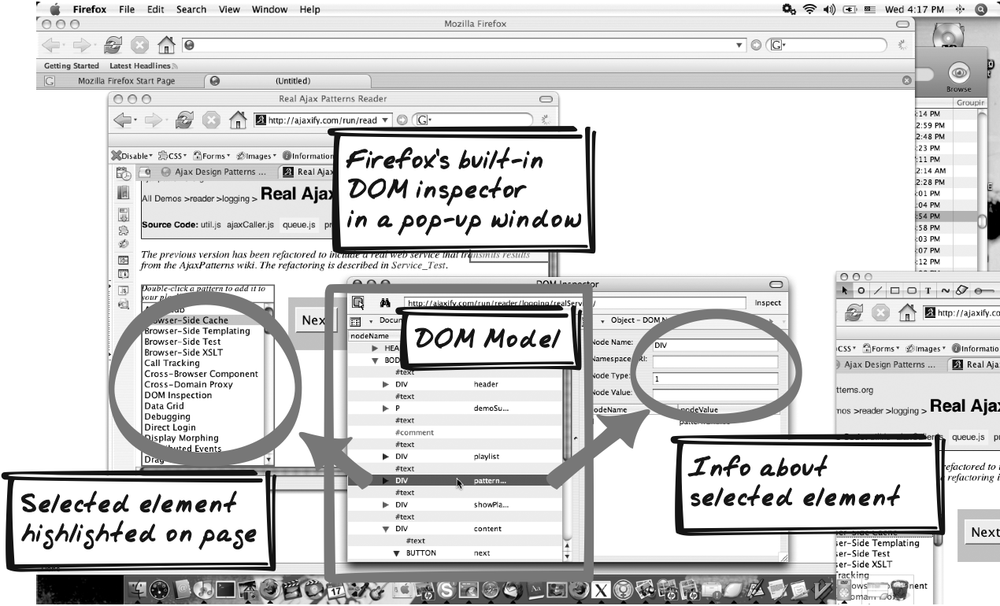
Firefox DOM Inspector
Firefox ships with a DOM Inspector tool, accessible from the tools menu (Figure 18-7).[*] The inspector is a popup window showing the DOM hierarchy on one side and facing a summary of the selected node. The summary shows node attributes such as registered event handlers, as well as CSS style information.
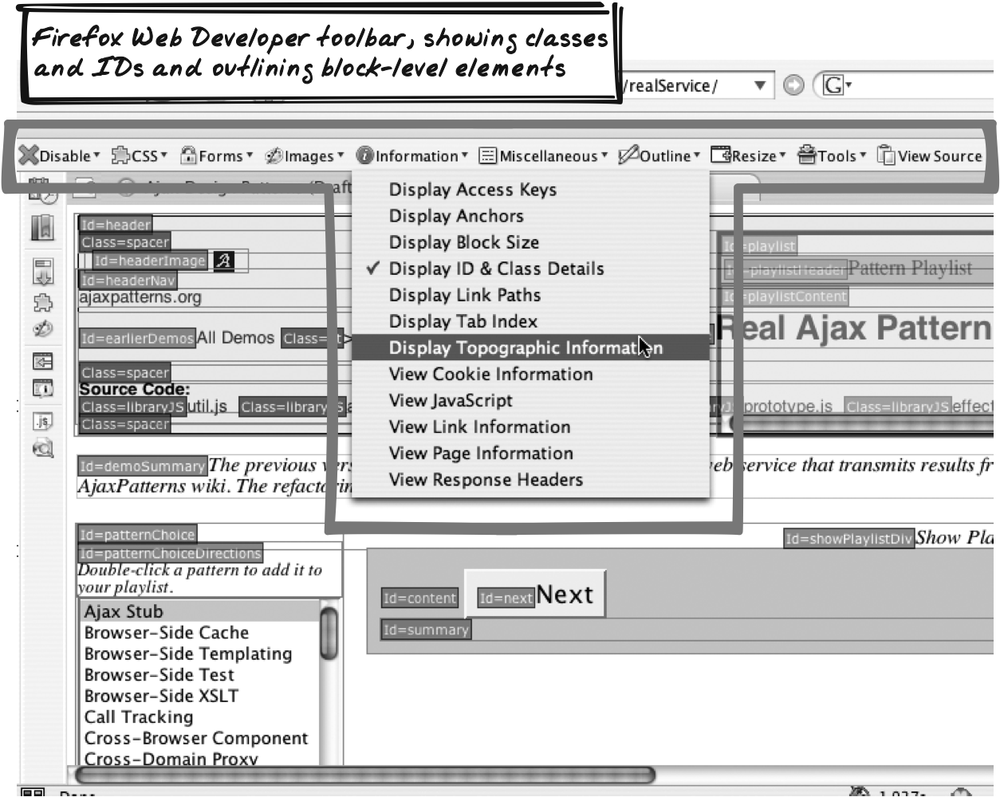
Firefox Web Developer Extension
Chris Pederick’s Web Developer extension (http://chrispederick.com/work/webdeveloper/) is an invaluable Firefox toolbar for web development (Figure 18-8). Among its vast feature set are several commands especially relevant to DOM Inspection:
- Display
These commands augment the page with DOM information, which makes a great alternative to exploring the DOM in a completely separate view. For example, Display Topographic Information alters the page to reveal the layout of DOM elements and Display ID and Class Details augments each element with its
idandclassattributes.- Outline
There commands—for example, Outline Block Level Elements or Outline Table Cells—draw outlines around elements of a particular type. In fact, you can define custom outlines to outline any element you want.
- Form
These commands help expose form structure. Display Form Details augments the form with information about each control, while View Form Information opens up a summary page.
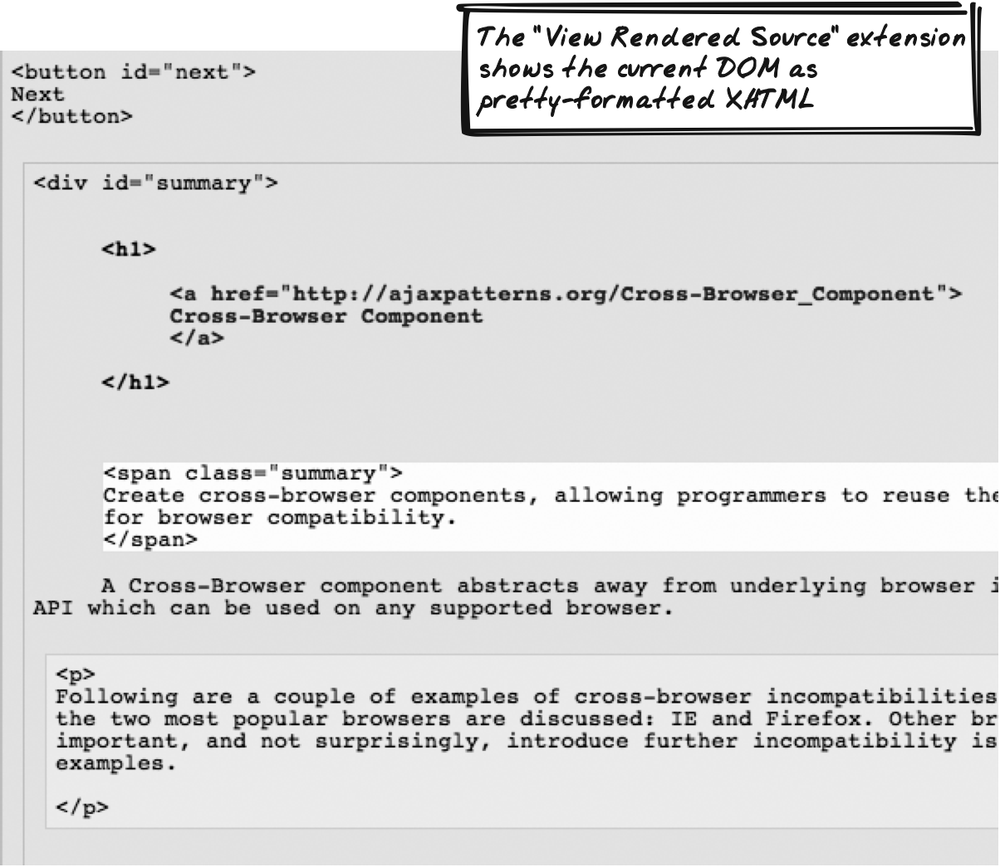
View Rendered Source
Jennifer Madden’s View Rendered Source (http://jennifermadden.com/scripts/ViewRenderedSource.html) is a Firefox extension that shows the entire DOM as an HTML document (Figure 18-9). Note that this is not the same thing as the good old View Source feature, because the rendered source reflects the DOM after any manipulation has taken place. The rendered source is shown in a pretty-formatted style, with colors and spacing to help convey the DOM structure. This is a free tool, and you can also purchase a slightly enhanced version for a small fee.
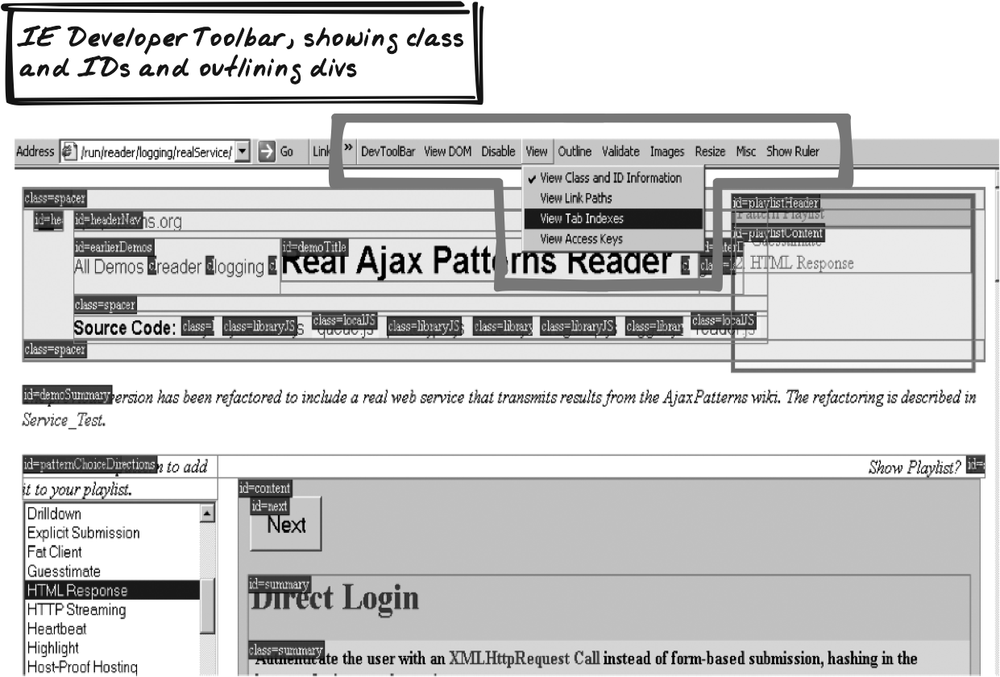
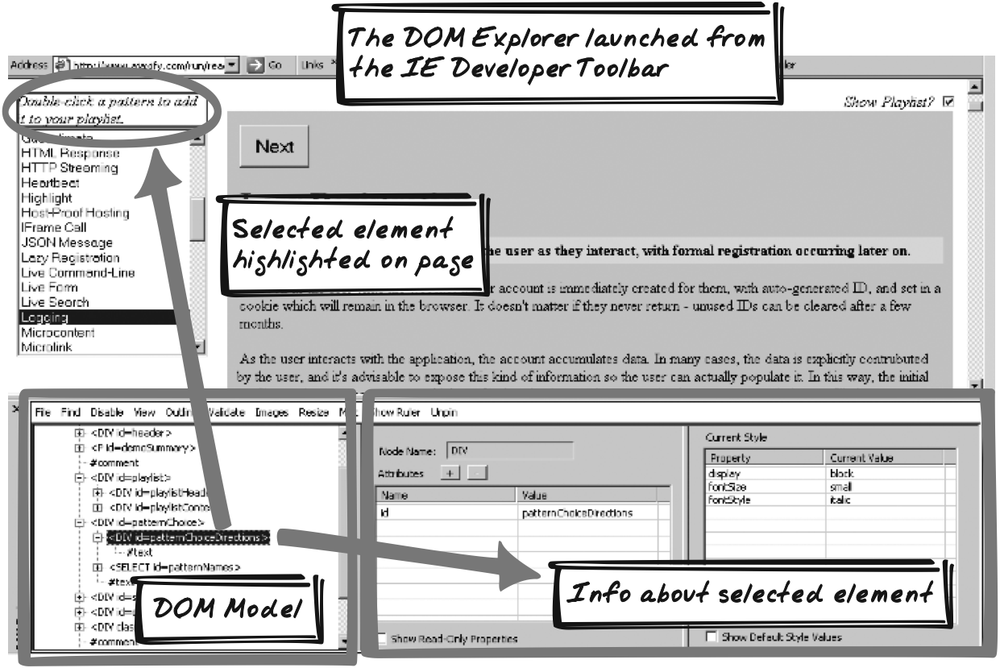
IE Developer Toolbar
Microsoft’s free IE Developer Toolbar for IE6+ (http://www.microsoft.com/downloads/details.aspx?FamilyID=e59c3964-672d-4511-bb3e-2d5e1db91038&displaylang=en) has a number of DOM Inspection capabilities and is similar to the Firefox Web Developer Extension (Figure 18-10). It also includes a DOM Explorer similar to Firefox’s DOM inspector (Figure 18-11).
You can find a list of IE DOM Inspectors at http://blogs.msdn.com/ie/archive/2005/05/10/416156.aspx.
IEDocMon
Tim Tabor’s IEDocMon (http://www.cheztabor.com/IEDocMon/index.htm) is an open source tool that extends IE to include an interactive view of the DOM.
Mouseover DOM Inspector
Steven Chipman’s Mouseover DOM Inspector (http://slayeroffice.com/tools/modi/v2.0/modi_help.html) is a convenient bookmarklet that lets you explore the DOM by mousing over page elements. It works on all recent browsers except Safari.
Traffic Sniffing
⊙ Capture, Intercept, Log, Monitor, Network, Record, Sniff, Traffic
Developer Story
Dave hears a report that critical form data isn’t
being saved on the database. He turns a sniffer on and tries
uploading the same data himself. The sniffer shows him an XML
message being uploaded via XMLHttpRequest. When inspecting the
message in an XML editor, he discovers that the JavaScript hasn’t
formatted it correctly.
Problem
How can you diagnose errors and strange behavior?
Solution
Diagnose problems by sniffing Web Remoting traffic. Many Ajax problems arise because Web Remoting (Chapter 6) messages are either wrong or are not sent at all. Debugging (see earlier in this chapter) and general Logging on either side of the network might help you infer what’s being transmitted, but it’s better to grab the traffic directly. There are various ways to do this:
In the browser, use XMLHttpRequest Calls (Chapter 6) in a wrapper that logs the request and response (see Logging earlier in this chapter). This may be the most convenient technique, because the programmer is probably already looking at the browser. The downside is that you’ll miss out on non-Web Remoting (Chapter 6) traffic, e.g., full page refreshes.
Employ a generic network traffic monitor, filtering HTTP traffic to and from the server.
Configure your browser to use a generic HTTP proxy and have the proxy log interesting traffic in either direction.
In the server, intercept incoming and outgoing traffic for Logging. Server-side frameworks often have a common controller object which can be instrumented to capture information in either direction. In addition, interception facilities, such as Java’s Servlet Filters, are often available.
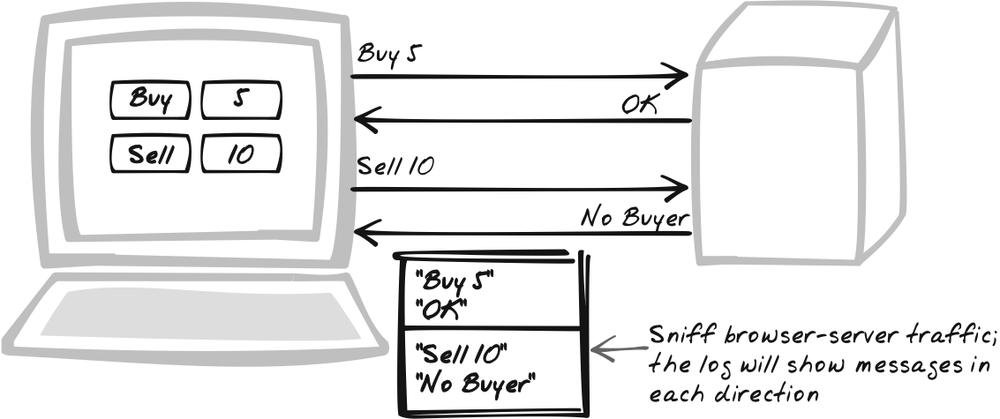
Traffic Sniffing is a kind of Logging function. As such, you’ll probably want similar filtering functionality, e.g., to see messages in only one direction, matching certain text, or to a particular URL.
Tool Support
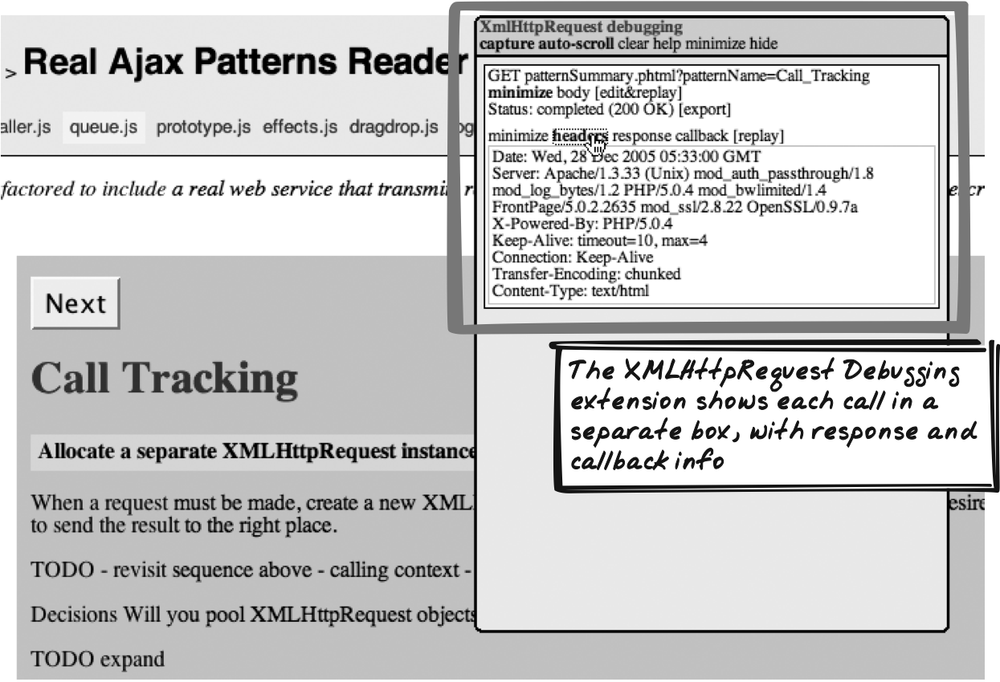
XMLHttpRequest Tracing and XMLHttpRequest Debugging
Julien Couvreur has written two invaluable Firefox tools:
XMLHttpRequest Tracing (http://blog.monstuff.com/archives/000252.html)
unobtrusively logs traffic to the JavaScript console, while
XMLHttpRequest
Debugging (http://blog.monstuff.com/archives/images/XMLHttpRequestDebugging.v1.0.user.js)
is a much more powerful, interactive Popup
tool that not only shows the messages but lets you set filters and
configure the display (Figure
18-13). Both are Greasemonkey scripts (http://greasemonkey.mozdev.org/), so
you’ll need to install the Greasemonkey extension first.
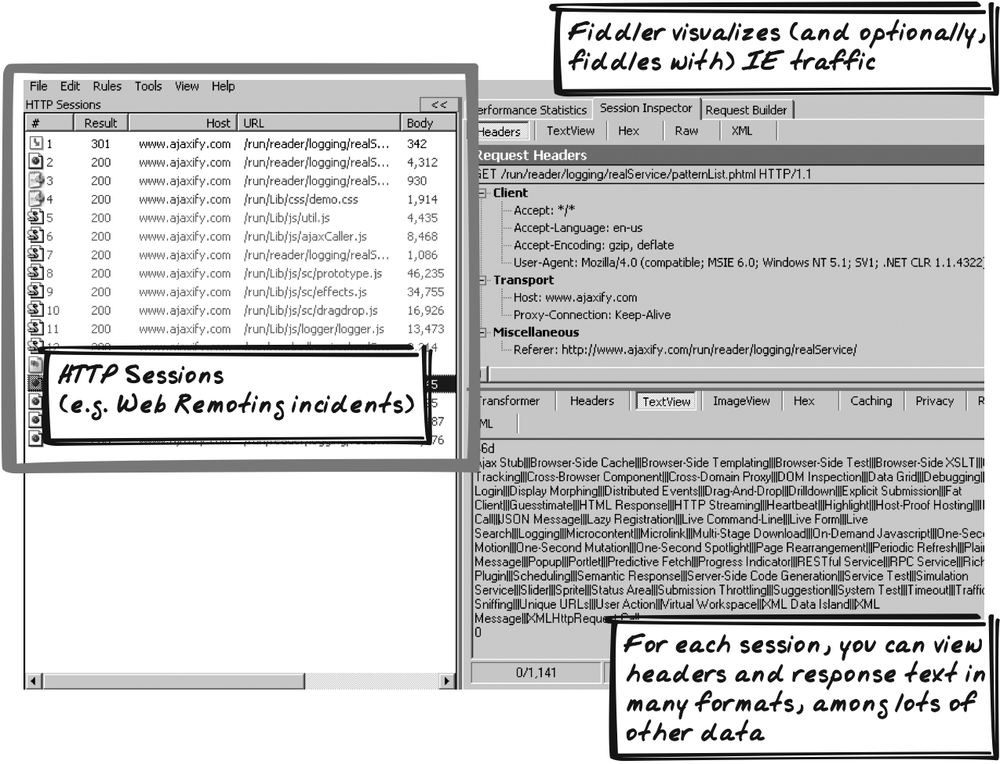
Fiddler
Fiddler (http://www.fiddlertool.com/Fiddler/dev/) is a Windows proxy specifically designed for analyzing and “fiddling” with browser-server traffic (Figure 18-14).
FlangeLib
Adam Vandenberg has noted that his personal
flangelib.js library (http://www.livejournal.com/users/piehead/tag/javascript)
contains an XMLHttpRequest
wrapper to log traffic. While you’re unlikely to use
flangelib, it’s mentioned here because some
XMLHttpRequest wrapper
libraries may eventually implement Logging
functionality. The main barrier right now is the
lack of an industry-standard Logging library.
Code Example: Using XMLHttpRequest Tracing
Following is the output from the XMLHttpRequest Tracing script during the initial load sequence for the Ajax
Patterns Reader (http://www.ajaxify.com/run/reader/logging/realService/).
First, the request is logged in the Firefox JavaScript
console:
  http://blog.monstuff.com/XmlHttpRequestTracing: [736] intercepted open (GET ,
patternList.phtml ,
true , undefined , undefined)
  http://blog.monstuff.com/XmlHttpRequestTracing: [736] intercepted send (null)
Then, the result is displayed, showing response code (200) and content:
  http://blog.monstuff.com/XmlHttpRequestTracing: [736] intercepted load: 200
Ajax Stub|||Browser-Side
Cache|||Browser-Side Templating|||Browser-Side XSLT||| ....
[*] Ajax—more specifically, XMLHttpRequest—has been labelled a
technique for “spying on users” (http://www.devx.com/webdev/Article/28861).
However, techniques for remote Logging have
been available for a long time. The main impact of Ajax is to
increase rich activity in the browser, which might create
further incentives to log user activity. See http://www.softwareas.com/spying-on-users-with-xmlhttprequest.
[*] In Windows, you need to ensure that the Web Developer Tools option (http://www.clagnut.com/blog/340/) is selected during installation.
Get Ajax Design Patterns now with the O’Reilly learning platform.
O’Reilly members experience books, live events, courses curated by job role, and more from O’Reilly and nearly 200 top publishers.

