June 2019
Intermediate to advanced
308 pages
7h 21m
English
The following graph shows the validation result of the LSTM used on the CPU utilization dataset:
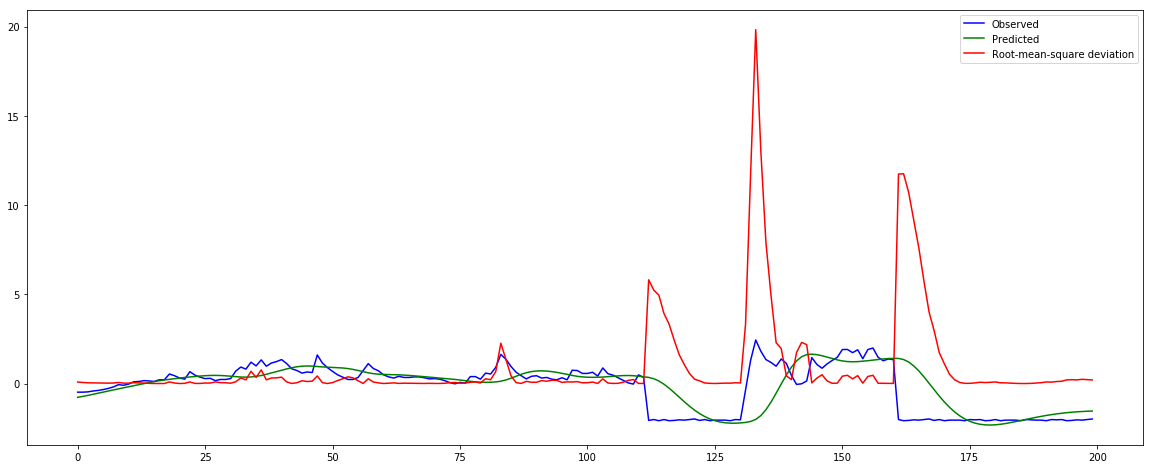
As we can see in the graph, the prediction follows the nonanomalous or 'normal' CPU utilization data series closely, and this is a hint that it is working fine. Importantly, when it finds the anomalous observations, the difference between the observed and predicted CPU utilization values (normalized) are significantly different to the normal behavior. This is an indication that there might be a DoS or DDoS attack to the IoT device. The error differences are plotted as a root mean squared (RMS) value, one of the ...
Read now
Unlock full access


