May 2020
Beginner to intermediate
634 pages
15h 49m
English
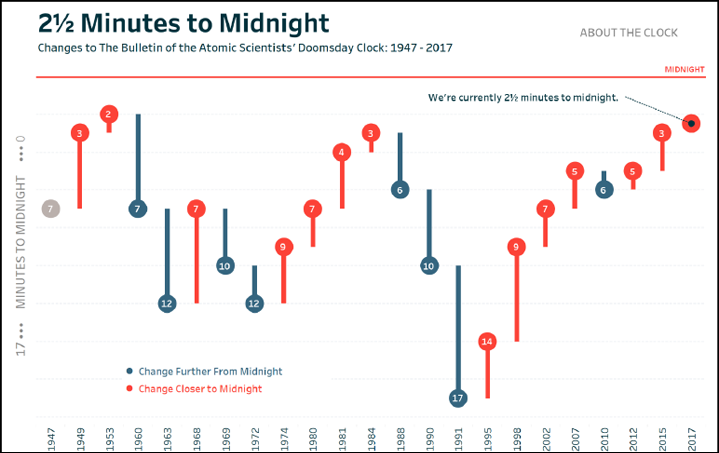
In this tutorial, we use my 2½ Minutes to Midnight visualization to create a waterfall chart in Tableau. A waterfall chart shows the progression toward a cumulative result by showing how positive or negative values contribute to the total. In my data visualization, the waterfall chart was an effective choice for showing how we’ve moved closer to and further from midnight on the Doomsday Clock since its inception in 1947. We eventually end up at—you guessed it—2½ minutes to midnight. In a corporate environment, waterfall charts can be a great choice for showing how specific segments are contributing to your end goals and/or the makeup of the result.
In addition to the foundational waterfall chart, I’ll show you how to use a dual axis to add value to this type of data visualization. In my example, the dual axis is used to display the absolute number of minutes to midnight after each change. In a corporate setting, we can use the second axis to show absolute changes, percent changes, or some other metric of choice. I also like that the dual axis creates a kind of teardrop effect that helps communicate the direction of the change.
Before we begin, let’s look at how the final visual will look:
The data used to create this waterfall chart is quite simple, consisting ...
Read now
Unlock full access


 O’Reilly covers everything we've got, with content to help us build a world-class technology community, upgrade the capabilities and competencies of our teams, and improve overall team performance as well as their engagement.I wanted to learn C and C++, but it didn't click for me until I picked up an O'Reilly book. When I went on the O’Reilly platform, I was astonished to find all the books there, plus live events and sandboxes so you could play around with the technology.I’ve been on the O’Reilly platform for more than eight years. I use a couple of learning platforms, but I'm on O'Reilly more than anybody else. When you're there, you start learning. I'm never disappointed.I'm always learning. So when I got on to O'Reilly, I was like a kid in a candy store. There are playlists. There are answers. There's on-demand training. It's worth its weight in gold, in terms of what it allows me to do.