CHAPTER 2 Start with Charts
In Section 2, “Start with Charts,” different types of charts are discussed. This includes different ways of viewing X-axis increments, such as natural and intraday time charts and range charts. Various display types are presented, such as bar, candlestick, line on close, and point and figure charts. Also included in this section are how to draw support, resistance, and trendlines, and how do deal with some unique features of futures charts.
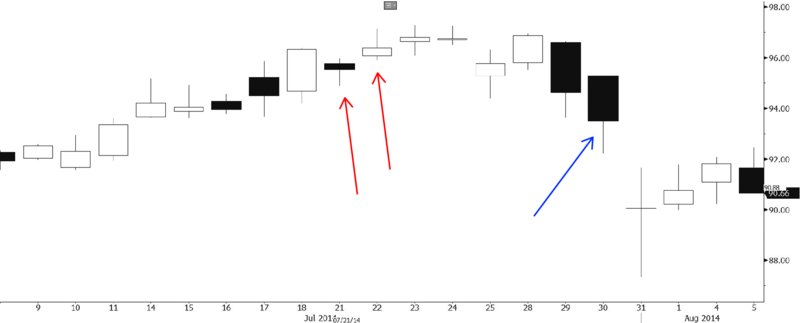
QUESTION 2.1 CI Chart

- What type of chart (plot type) is this?
- What increments or intervals describe the X and Y axes?
- For the plot to which the blue arrow is pointing, label the open, high, low, and close.
- Also, list the parts of the plot, and which part isn't showing.
- How would you designate the plots to which the red arrows are pointing?
- For those plots, is it significant that one is filled in and the other empty?
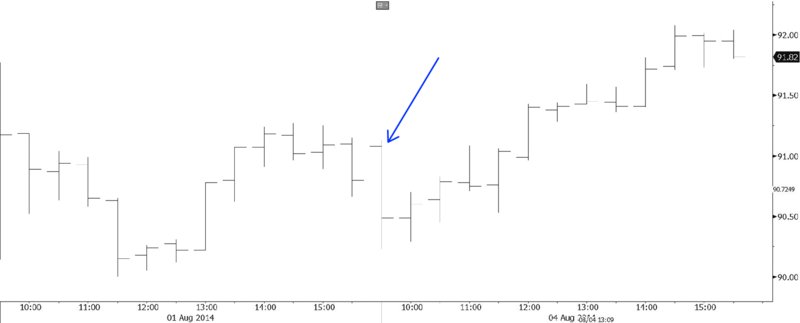
QUESTION 2.2 CI US 30M Chart

- What type of chart (plot type) is this?
- Is this a natural time increment chart or another X-axis type?
- For the plot to which the blue arrow is pointing, label the open, high, low, and close.
- Draw an up-sloping trendline.
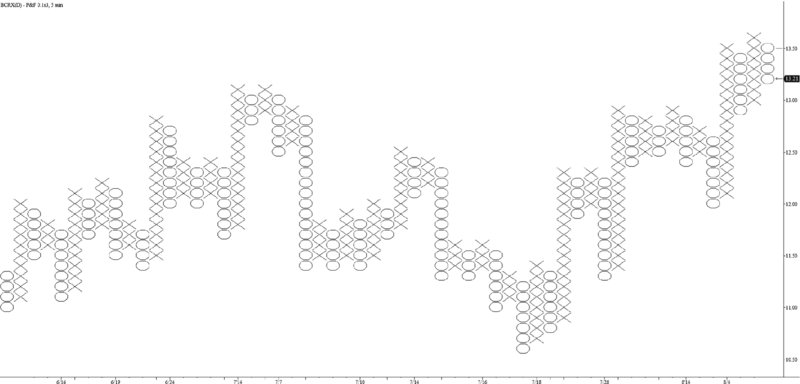
QUESTION 2.3 BCRX 0.10*3

- What do ...
Get Kase on Technical Analysis Workbook, + Video Course now with the O’Reilly learning platform.
O’Reilly members experience books, live events, courses curated by job role, and more from O’Reilly and nearly 200 top publishers.

