CHAPTER 2
CHAPTER 2. Fundamentals of Mapping Experiences
“The purpose of visualization is insight, not pictures.”
IN THIS CHAPTER
- Framing the mapping effort
- Touchpoints
- Moments of truth
- Value creation
- Case Study: Identifying Opportunities: Combining Mental Model Diagrams and Jobs to Be Done
In my first book, Designing Web Navigation, I discuss the principle of transitional volatility. First described by David Danielson in 2003, transitional volatility is the degree of reorientation a person experiences when moving from page to page in a website. If there is too much volatility, they get lost in hyperspace.
Figure 2-1 shows this pattern of interaction. It’s a sequence of becoming accustomed to one location (habituate), forming an expectation about the next point (predict), and then adjusting to a new position (reorient). The pattern then repeats.
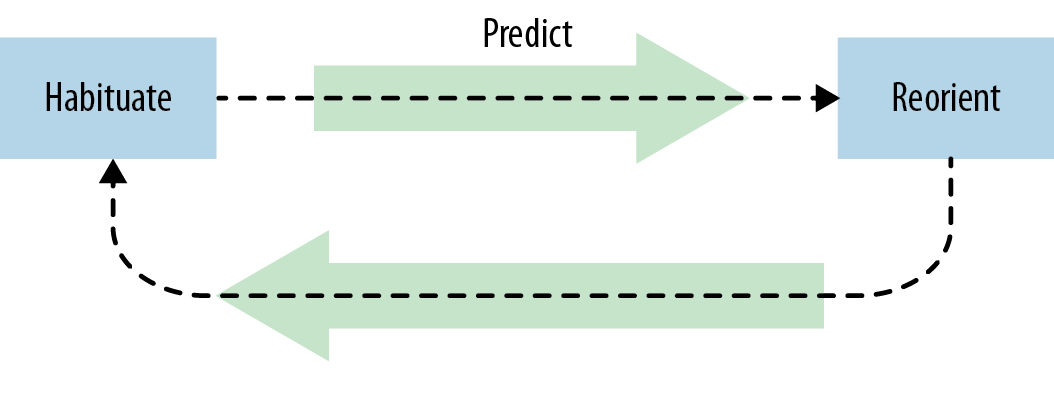
FIGURE 2-1. The pattern of transitional volatility across points of interaction.
We see the same thing happening on a larger scale when individuals interact with an organization. Instead of page to page, they move from touchpoint to touchpoint. At each interaction there is a reorientation period, even if brief. If there is too much reorientation at each touchpoint, the experience feels disjointed.
A high degree of transitional volatility arises from an inconsistency in ...
Get Mapping Experiences now with the O’Reilly learning platform.
O’Reilly members experience books, live events, courses curated by job role, and more from O’Reilly and nearly 200 top publishers.

