March 2017
Beginner to intermediate
1065 pages
27h 7m
English
As we can also notice from the scatterplot, whereas most of the samples have a relatively balanced proportion of red or even numbers, these proportions are very small or large in some cases. We could examine the dispersion of those values using a histogram again, but the boxplot is much more interesting, so we will use it instead. Boxplots are representations of the distribution of an attribute. We could have a look at only one attribute by specifying its name as an argument from the boxplot() function. We will instead look at all the arguments at once by giving the data frame as an argument:
boxplot(samples)
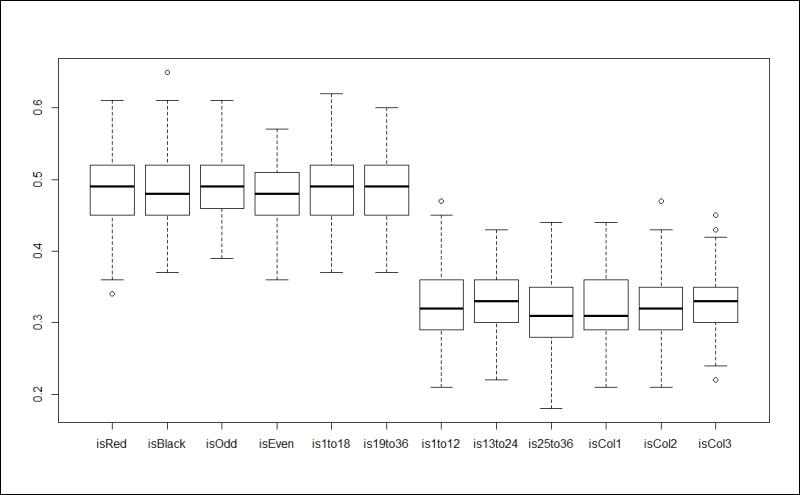
Boxplots of all the attributes ...
Read now
Unlock full access


 O’Reilly covers everything we've got, with content to help us build a world-class technology community, upgrade the capabilities and competencies of our teams, and improve overall team performance as well as their engagement.I wanted to learn C and C++, but it didn't click for me until I picked up an O'Reilly book. When I went on the O’Reilly platform, I was astonished to find all the books there, plus live events and sandboxes so you could play around with the technology.I’ve been on the O’Reilly platform for more than eight years. I use a couple of learning platforms, but I'm on O'Reilly more than anybody else. When you're there, you start learning. I'm never disappointed.I'm always learning. So when I got on to O'Reilly, I was like a kid in a candy store. There are playlists. There are answers. There's on-demand training. It's worth its weight in gold, in terms of what it allows me to do.