5 Distribution Platform Continuous Variable Graphs and Reports 115
5 Distribution: Single-Variable Statistics
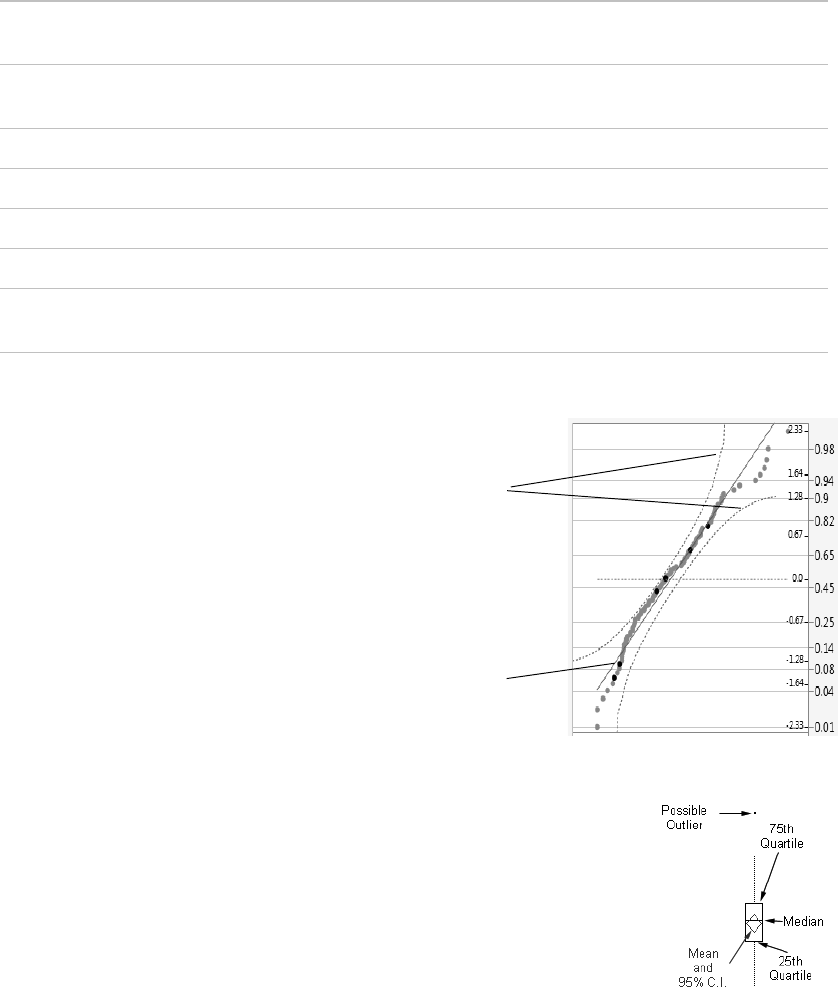
Normal Quantile Plots
The Normal Quantile Plot option
adds a graph to the report that is used
to visualize the extent to which the
variable is normally distributed. If a
variable is normal, the normal quan-
tile plot is approximately a diagonal
straight line. This type of plot is
sometimes also called a quan-
tile-quantile plot, or q-q plot.
The Normal Quantile plot also shows
confidence bounds. If the data fall
within these confidence bounds, the
data are approximately normal.
Outlier Box Plots
The Outlier Box Plot is a schematic that shows ...


