Skip to Content
Visualizzazione dei dati con Microsoft Power BI
book

Visualizzazione dei dati con Microsoft Power BI

by Alex Kolokolov, Maxim Zelensky
March 2025
Intermediate to advanced
416 pages
10h 21m
Italian
O'Reilly Media, Inc.
Content preview from Visualizzazione dei dati con Microsoft Power BI

Capitolo 8. Schede KPI

Questo lavoro è stato tradotto utilizzando l'AI. Siamo lieti di ricevere il tuo feedback e i tuoi commenti: translation-feedback@oreilly.com

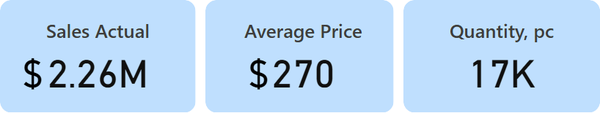
Nella parte superiore di quasi tutti i dashboard, troverai delle schede che visualizzano i valori riassuntivi. Questi sono i primi elementi che attirano l'attenzione dell'utente, quindi posizioniamo gli indicatori chiave di prestazione (KPI) in cima alla pagina del report. Il termine "KPI" può avere diversi contesti. Da un punto di vista aziendale, è l'obiettivo rispetto al quale confrontiamo il valore attuale dell'indicatore. Da un punto di vista più semplicemente tecnico, si tratta di qualsiasi valore totale che riteniamo importante e che inseriamo nelle schede. Nella Figura 8-1, puoi vedere un esempio delle schede più semplici che ci forniscono un riepilogo: abbiamo guadagnato 2,26 milioni di dollari, vendendo a un prezzo medio di 270 dollari circa 17.000 unità del prodotto.

Figura 8-1. Diverse carte base con un unico valore

Di solito, una scheda KPI contiene non solo un singolo valore, ma anche un indicatore aggiuntivo in base al quale possiamo valutare se è buono o cattivo (a volte chiamato valore di riferimento). Facciamo un esempio di vendita di un prodotto digitale con tre piani di abbonamento: base, avanzato e premium. Nella Figura 8-2 è riportata una serie di tre schede che forniscono un quadro più dettagliato ...

Become an O’Reilly member and get unlimited access to this title plus top books and audiobooks from O’Reilly and nearly 200 top publishers, thousands of courses curated by job role, 150+ live events each month,
and much more.

Read now

Unlock full access

More than 5,000 organizations count on O’Reilly

AirBnbBlueOriginElectronic ArtsHomeDepotNasdaqRakutenTata Consultancy Services

QuotationMarkO’Reilly covers everything we've got, with content to help us build a world-class technology community, upgrade the capabilities and competencies of our teams, and improve overall team performance as well as their engagement.
Julian F.
Head of Cybersecurity
QuotationMarkI wanted to learn C and C++, but it didn't click for me until I picked up an O'Reilly book. When I went on the O’Reilly platform, I was astonished to find all the books there, plus live events and sandboxes so you could play around with the technology.
Addison B.
Field Engineer
QuotationMarkI’ve been on the O’Reilly platform for more than eight years. I use a couple of learning platforms, but I'm on O'Reilly more than anybody else. When you're there, you start learning. I'm never disappointed.
Amir M.
Data Platform Tech Lead
QuotationMarkI'm always learning. So when I got on to O'Reilly, I was like a kid in a candy store. There are playlists. There are answers. There's on-demand training. It's worth its weight in gold, in terms of what it allows me to do.
Mark W.
Embedded Software Engineer

You might also like

Imparare Microsoft Power Automate

Imparare Microsoft Power Automate

Paul Papanek Stork
What Successful Project Managers Do

What Successful Project Managers Do

W. Scott Cameron, Jeffrey S. Russell, Edward J. Hoffman, Alexander Laufer
How to Overcome a Power Deficit

How to Overcome a Power Deficit

Cyril Bouquet, Jean-Louis Barsoux

Publisher Resources

ISBN: 9798341639041