Here is the KMO and Bartlett's Test table:
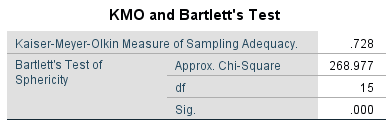
Recall that for the KMO Measure of Sampling Adequacy statistic, bigger is better. A value of 0.728 is sufficiently high enough to proceed. In addition, Bartlett's Test of Sphericity has an associated p-value of < .0005, so we reject the null hypothesis that the six items are mutually uncorrelated.
Here is the Communalities table for the one-factor model:

As already mentioned, the Initial communalities denotes the squared multiple correlations of the given variable, along with ...

