October 2018
Beginner
362 pages
9h 32m
English
You've probably seen a chart such as the following one; it's showing us the values that appear in a dataset, and how many times those values appear. This is called a distribution of a variable. In this particular case, we're displaying the distribution with the help of a histogram, which shows the frequency of the variables:
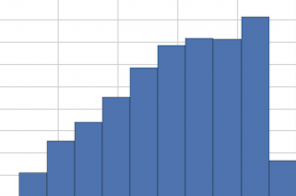
In this section, we're interested in a particular type of distribution, called a probability distribution. When we talk about probability distributions, we're talking about the likelihood of a random variable taking on a certain value, and we create one by dividing the frequencies in the preceding ...
Read now
Unlock full access


