Skip to Content
Microsoft Power BI によるデータの視覚化
book

Microsoft Power BI によるデータの視覚化

by Alex Kolokolov, Maxim Zelensky
March 2025
Beginner to intermediate
416 pages
6h 16m
Japanese
O'Reilly Media, Inc.
Content preview from Microsoft Power BI によるデータの視覚化

第15章. 弾丸チャート

この作品はAIを使って翻訳されている。ご意見、ご感想をお待ちしている:translation-feedback@oreilly.com

練習については、このデータセットをダウンロードしてほしい。

弾丸チャート は、図15-1のような、目標値と実績値を持つ棒グラフの進化版である。考え方は簡単で、実績値が計画バーの内側にあるようにバーを組み合わせ、樽の中の弾丸のように目標レベルに向かう。言い換えれば、販売チャネルがどのように「発射」(目標を上回る)するか、あるいは銃の中にとどまっているかを見るのである。

図15-1. 販売チャネル別の目標マージンと実績マージンを示す箇条書きチャート

箇条書きチャートのオプション

図15-1は、目標対実績を表示する最も単純なアプローチを示している 。しかし、ビジネスの状況に応じて、さまざまな選択肢がある。例えば、業績目標の達成度を理解するだけでなく、その偏差がどの許容範囲に入るかを判断することも重要である。

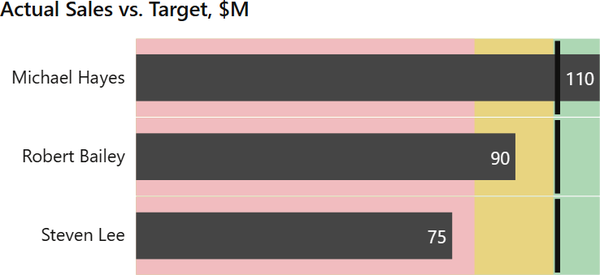
図15-2では、赤色の領域(ピンク色に見えるかもしれない)を80%未満、黄色を80%以上100%未満、緑色を100%以上としている。また、チャートのオーバーロードを避けるため、目標値は縦に目盛りを付けて示している。図15-2は、各マネージャーが1億ドルの売上目標を持つ会社のケースである:

  • マイケル・ヘイズは販売目標を110%達成し、ボーナスを受け取ることになった。

  • ロバート・ベイリーが計画を90%達成したが、それでもボーナスは出る。

  • スティーブン・リーは目標の75%しか達成できず、赤色の領域に入っている。

図15-2. 売上目標の実行を「良い-悪い」のカラースケールで示す

企業の場合、KPIの計算システムはかなり高度である可能性があり、計画を上回った場合、削減要因と引き上げ要因の両方が存在する可能性がある。図15-3のように、それを示すためにカラーゾーンの数を増やし、危険な赤色をニュートラルな灰色に置き換えることで、より正のモチベーションを高めることができる。

図15-3. ニュートラル・グッド」のカラー・スケールで示された売上目標の実行状況

通常、企業は「誰が一番売れるか」だけにこだわるのではなく、製品ポートフォリオや市場などに基づいて、マネジャーごとに異なる目標をセットする。最初のケースで7,500万ドルを掲げて部外者のように見えたリー(図15-4)が7,000万ドルの計画を上回っているのに対し、ヘイズは1億2,000万ドルの計画を掲げていて、まだ達成できていないのかもしれない。

図15-4. 個人目標を設定した管理職の売上実績

箇条書きチャートは、複雑なKPIシステムを持つ企業だけでなく、多くの種類のビジネスに有用である。目標が達成されたかどうかという二項対立の問題に戻り、 ...

Become an O’Reilly member and get unlimited access to this title plus top books and audiobooks from O’Reilly and nearly 200 top publishers, thousands of courses curated by job role, 150+ live events each month,
and much more.

Read now

Unlock full access

More than 5,000 organizations count on O’Reilly

AirBnbBlueOriginElectronic ArtsHomeDepotNasdaqRakutenTata Consultancy Services

QuotationMarkO’Reilly covers everything we've got, with content to help us build a world-class technology community, upgrade the capabilities and competencies of our teams, and improve overall team performance as well as their engagement.
Julian F.
Head of Cybersecurity
QuotationMarkI wanted to learn C and C++, but it didn't click for me until I picked up an O'Reilly book. When I went on the O’Reilly platform, I was astonished to find all the books there, plus live events and sandboxes so you could play around with the technology.
Addison B.
Field Engineer
QuotationMarkI’ve been on the O’Reilly platform for more than eight years. I use a couple of learning platforms, but I'm on O'Reilly more than anybody else. When you're there, you start learning. I'm never disappointed.
Amir M.
Data Platform Tech Lead
QuotationMarkI'm always learning. So when I got on to O'Reilly, I was like a kid in a candy store. There are playlists. There are answers. There's on-demand training. It's worth its weight in gold, in terms of what it allows me to do.
Mark W.
Embedded Software Engineer

You might also like

Microsoft Power BI による人工知能

Microsoft Power BI による人工知能

Jen Stirrup, Thomas J. Weinandy

Publisher Resources

ISBN: 9798341633377