Chapter 12. Using Colors in Plots
In ggplot2’s implementation of the grammar of graphics, colour is an
aesthetic, just like x position, y position, and size. If color is
just another aesthetic, why does it deserve its own chapter? The reason
is that color is a more complicated aesthetic than the others. Instead
of simply moving geoms left and right or making them larger and smaller,
when you use color, there are many degrees of freedom and many more
choices to make. What palette should you use for discrete values? Should
you use a gradient with several different hues? How do you choose colors
that can be interpreted accurately by those with color-vision
deficiencies? In this chapter, I’ll address these issues.
12.1 Setting the Colors of Objects
Problem
You want to set the color of some geoms in your graph.
Solution
In the call to the geom, set the values of colour or fill (Figure 12-1):
library(MASS)# Load MASS for the birthwt data setggplot(birthwt,aes(x=bwt))+geom_histogram(fill="red",colour="black")ggplot(mtcars,aes(x=wt,y=mpg))+geom_point(colour="red")
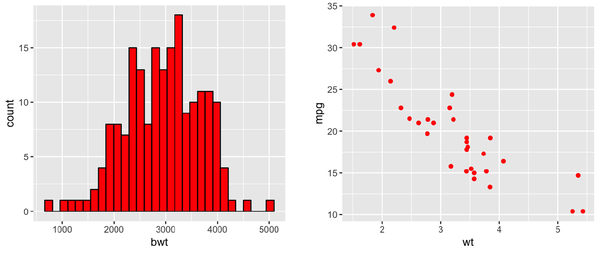
Figure 12-1. Setting fill and colour (left); Setting colour for points (right)
Discussion
In ggplot2, there’s an important difference between setting and
mapping aesthetic properties. In the preceding example, we set the
color of the objects to "red".
Generally speaking, colour controls the color ...
Get R Graphics Cookbook, 2nd Edition now with the O’Reilly learning platform.
O’Reilly members experience books, live events, courses curated by job role, and more from O’Reilly and nearly 200 top publishers.

