Skip to Content
R Programming By Example
book

R Programming By Example

by Omar Trejo Navarro
December 2017
Beginner to intermediate
470 pages
12h 29m
English
Packt Publishing
Content preview from R Programming By Example

Graphing top performers with bar graphs

Bar graphs are one of the most used graphing tools in the world and this chapter is no exception. In our last bar graph example, we will show how to graph the top performers for a given variable in the decreasing order. Our objective is to graph either PROFIT or Frequency in the y axis and a parameterized variable for the x axis. We want to show the top n performers for the x variable in a decreasing order from left to right, as is shown in the graph below.

Top n bar graphs

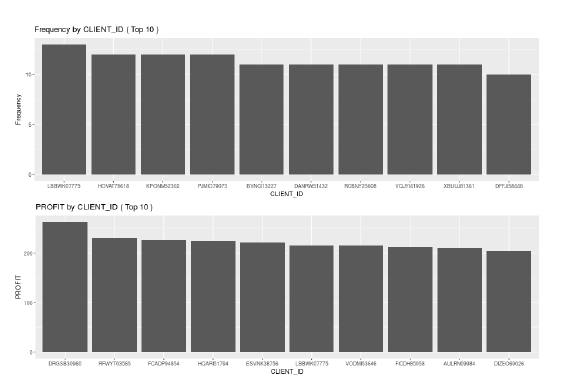
To accomplish this, we receive as parameters the data (sales in this case), the variable that will be used for the x axis x, the ...

Become an O’Reilly member and get unlimited access to this title plus top books and audiobooks from O’Reilly and nearly 200 top publishers, thousands of courses curated by job role, 150+ live events each month,
and much more.
Start your free trial

You might also like

Efficient R Programming

Efficient R Programming

Colin Gillespie, Robin Lovelace
R Programming

R Programming

Jared P. Lander

Publisher Resources

ISBN: 9781788292542Supplemental Content