December 2017
Beginner to intermediate
470 pages
12h 29m
English
Creating graphs with R Markdown is as easy as creating the within R. Actually, you don't need to do anything extra; knitr is smart enough to do it automatically. If you need to, specify the width and height for your image using the corresponding chunk options shown in the next section.
If we use the following input:
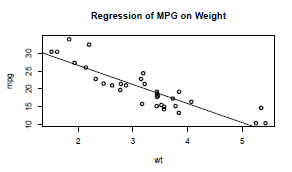
```{r basic-r-graph}
attach(mtcars)
plot(wt, mpg)
abline(lm(mpg ~ wt))
title("Regression of MPG on Weight")
```
We get the following output: